8 Reporting results
Once we have performed an enrichment analysis, how should we communicate the results? As with everything, it depends on what you need to convey. Some examples are below.
8.1 In text
If you just need to emphasise that the differential expression relates to a condition of interest, you don’t need much:
Genes differentially expressed after SH-SY5Y cell differentiation were enriched for the GO term “regulation of neurogenesis” (adjusted p-value < 0.01).
In the methods section:
Enrichment was calculated for differentially expressed genes using the g:GOSt enrichment tool (Raudvere et al, 2019) using a background of tested genes.
8.2 As a table
For a more complete view, a table of the significant or top n terms can be useful. e.g., in a supplementary figure.
The top 10 enriched GO terms for the differentially expressed genes are shown below:
| GO:BP Term | Term ID | Adjusted p-value | Term Size | Num DE Genes |
|---|---|---|---|---|
| system process | GO:0003008 | 2.90E-04 | 1243 | 45 |
| nervous system development | GO:0007399 | 4.19E-04 | 1985 | 60 |
| regulation of cell development | GO:0060284 | 1.98E-03 | 795 | 33 |
| central nervous system development | GO:0007417 | 2.67E-03 | 805 | 33 |
| regulation of neurogenesis | GO:0050767 | 5.59E-03 | 707 | 30 |
| regulation of nervous system development | GO:0051960 | 5.78E-03 | 790 | 32 |
| regulation of cell differentiation | GO:0045595 | 6.03E-03 | 1471 | 47 |
| multicellular organismal process | GO:0032501 | 2.04E-02 | 5300 | 111 |
| system development | GO:0048731 | 2.88E-02 | 3668 | 85 |
| neurogenesis | GO:0022008 | 4.36E-02 | 1375 | 43 |
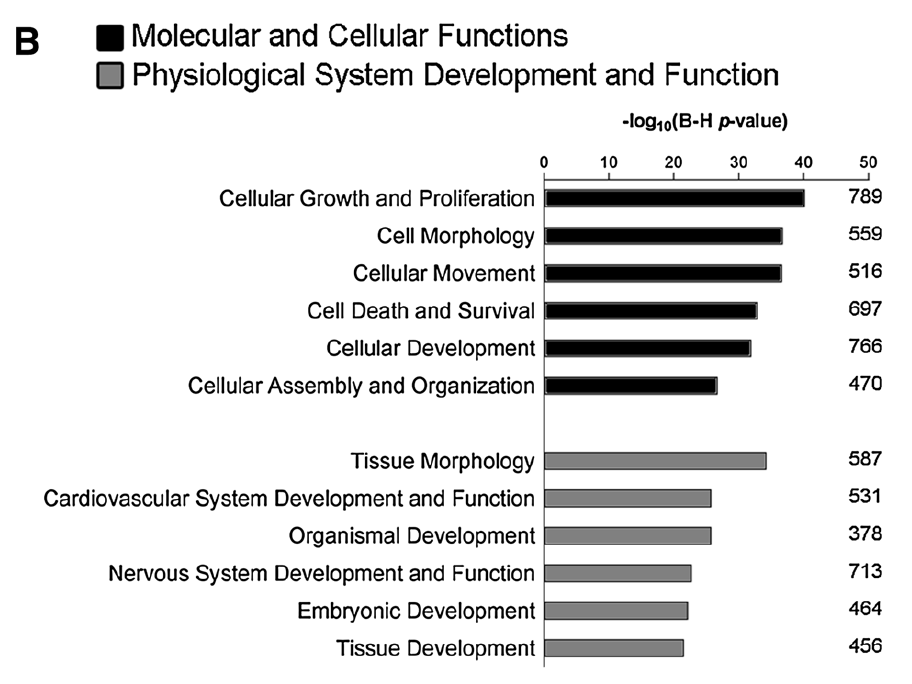
8.3 As a figure
Plots of –log(p-value) are a popular option for figures. By taking the negative logarithm of the p-value, larger bars indicate greater significance.
For instance, the following figure is taken from the (Pezzini et al. 2017) paper. Note that this figure shows two specific categories from the IPA (Ingenuity Pathway Analysis) database using the IPA tool (not covered here), so the terms differ.
You can also enhance such plots by including the number of genes and other attributes. For an example, see the “bubble” chart produced by the R package pathfindR: https://www.biostars.org/p/322415/
There are also tools like ClueGO (a Cytoscape plugin) that build enriched terms into a network : http://apps.cytoscape.org/apps/cluego