9 Resources
9.1 Links to data sets used in this workshop:
9.1.4 Reactome
Here is the R scripts used to create the data sets.
Required input files for the datasets.R file:
9.2 Web-based Tools
The following tools might be useful for downstream functional analysis; this includes some not covered in today’s workshop.
Note that most of these tools do more than just enrichment tests, and some include their own databases.
9.2.1 g:Profiler / g:GOSt
https://biit.cs.ut.ee/gprofiler/gost
The g:GOSt “functional profiling” tool of gProfiler calculates functional enrichment for gene lists, identifying enriched terms across various ontologies and pathways.
It features a clean, modern interface and provides a handy summary highlighting which genes contribute to the enrichment.
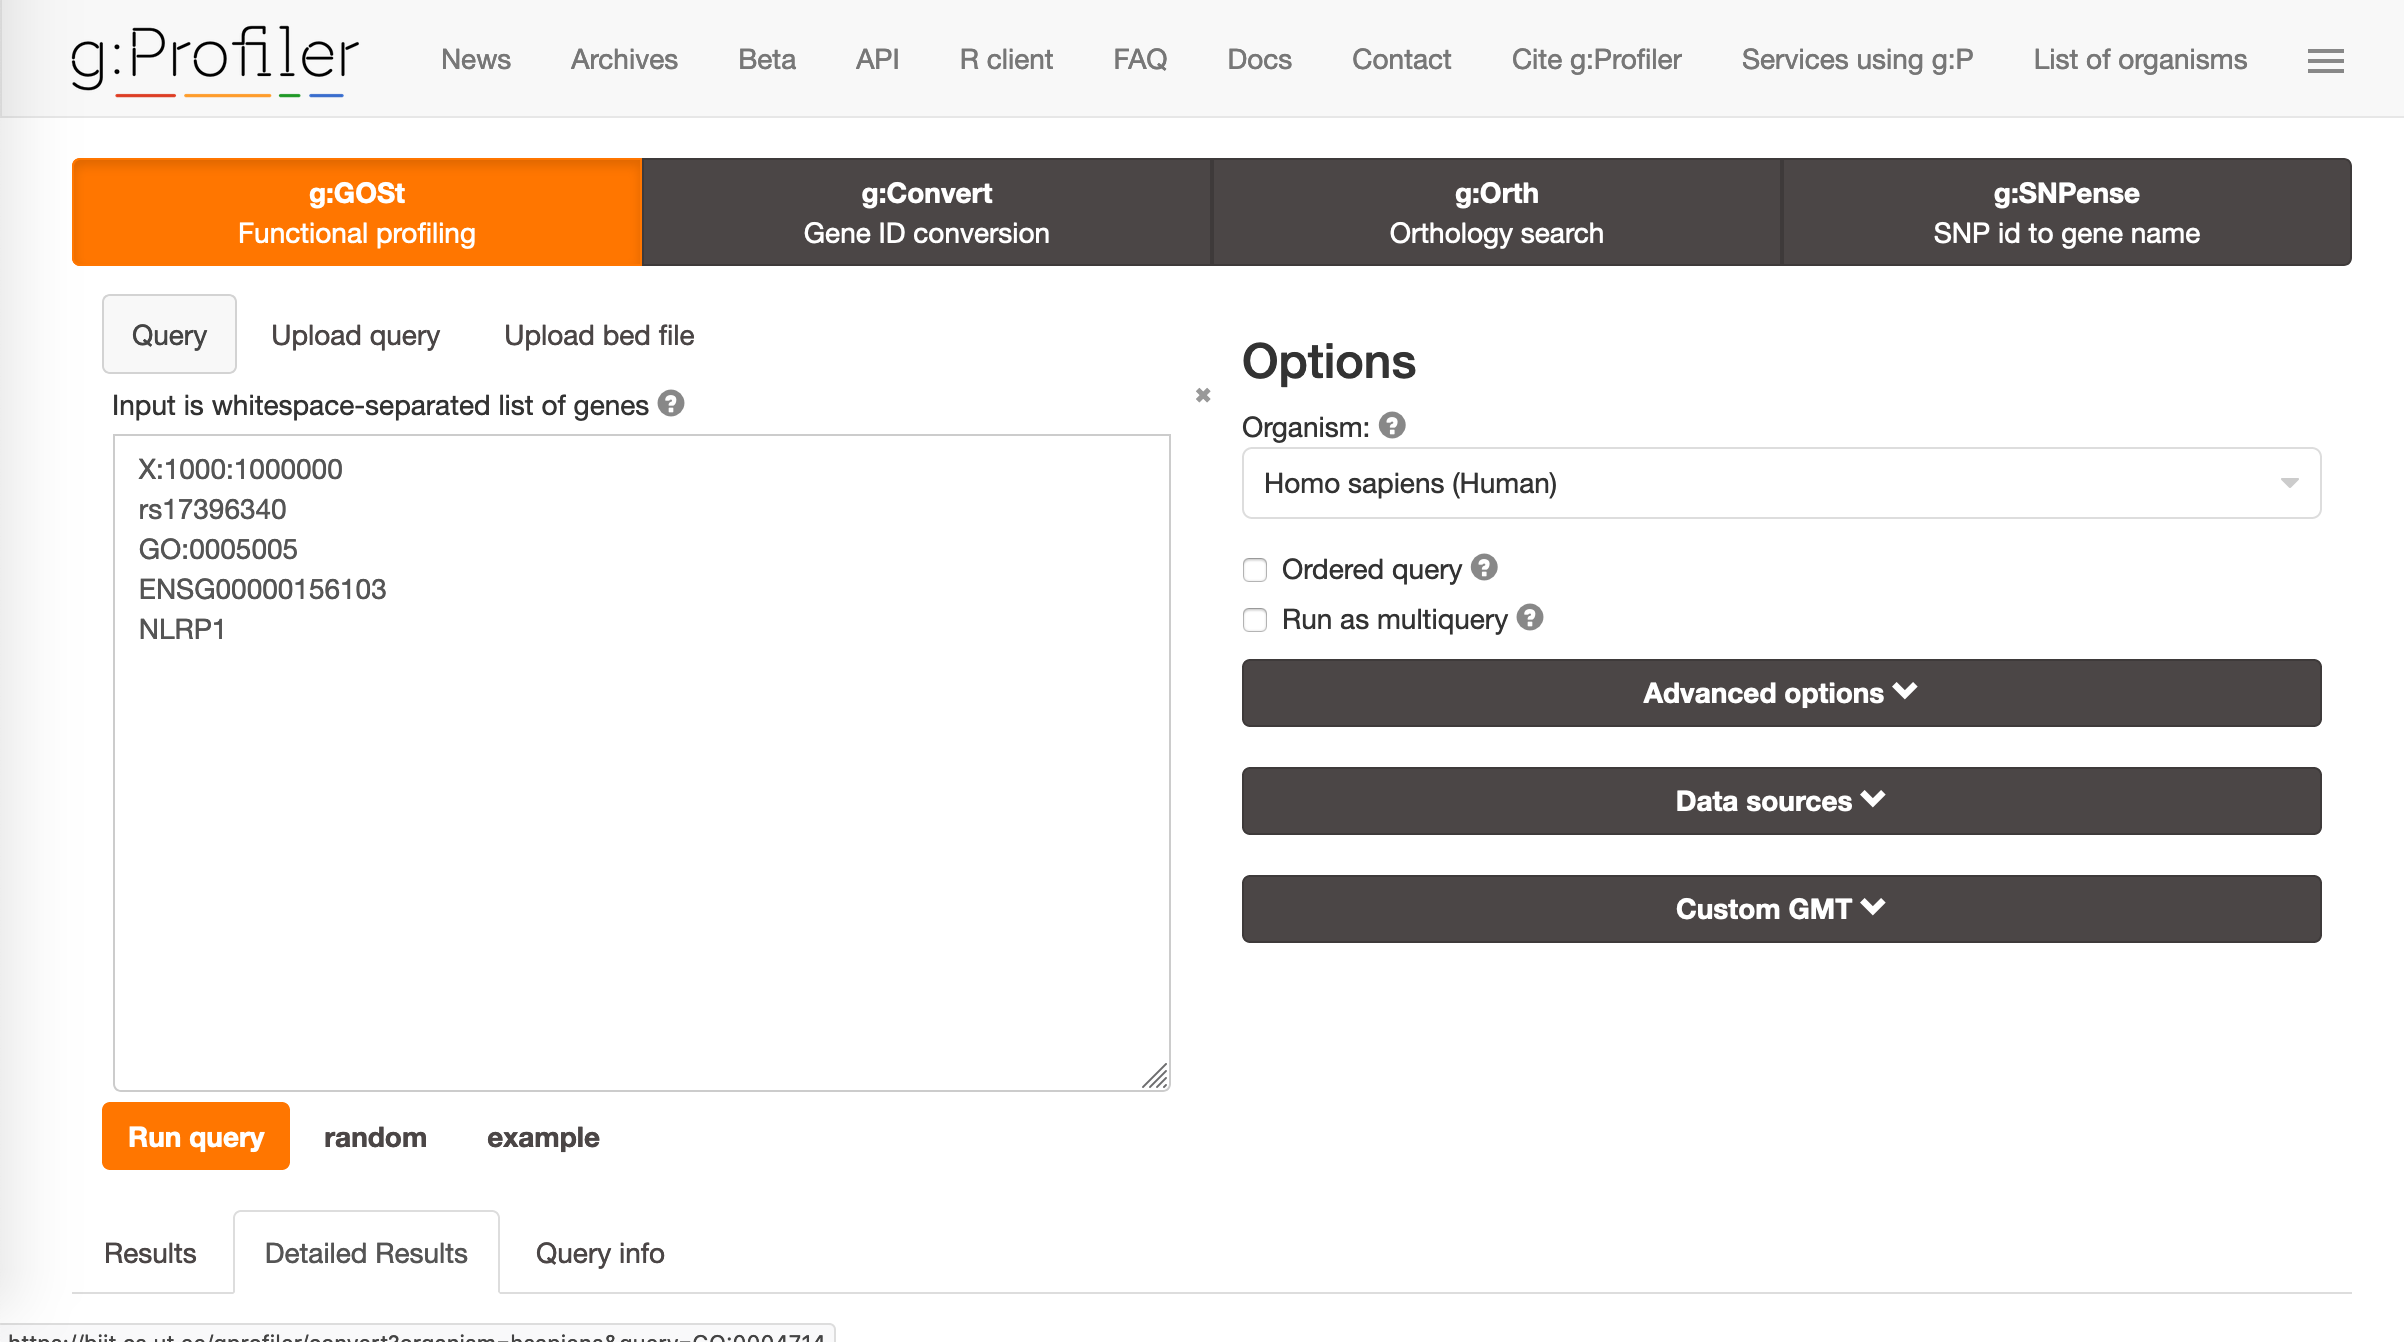
Figure 9.1: The gProfiler front page
9.2.2 PANTHER
PANTHER performs over-representation tests across multiple databases; Gene ontology, Reactome, PANTHER pathways and protein classes. It allows greater control over the statistical test used and clearly summarises what was performed.
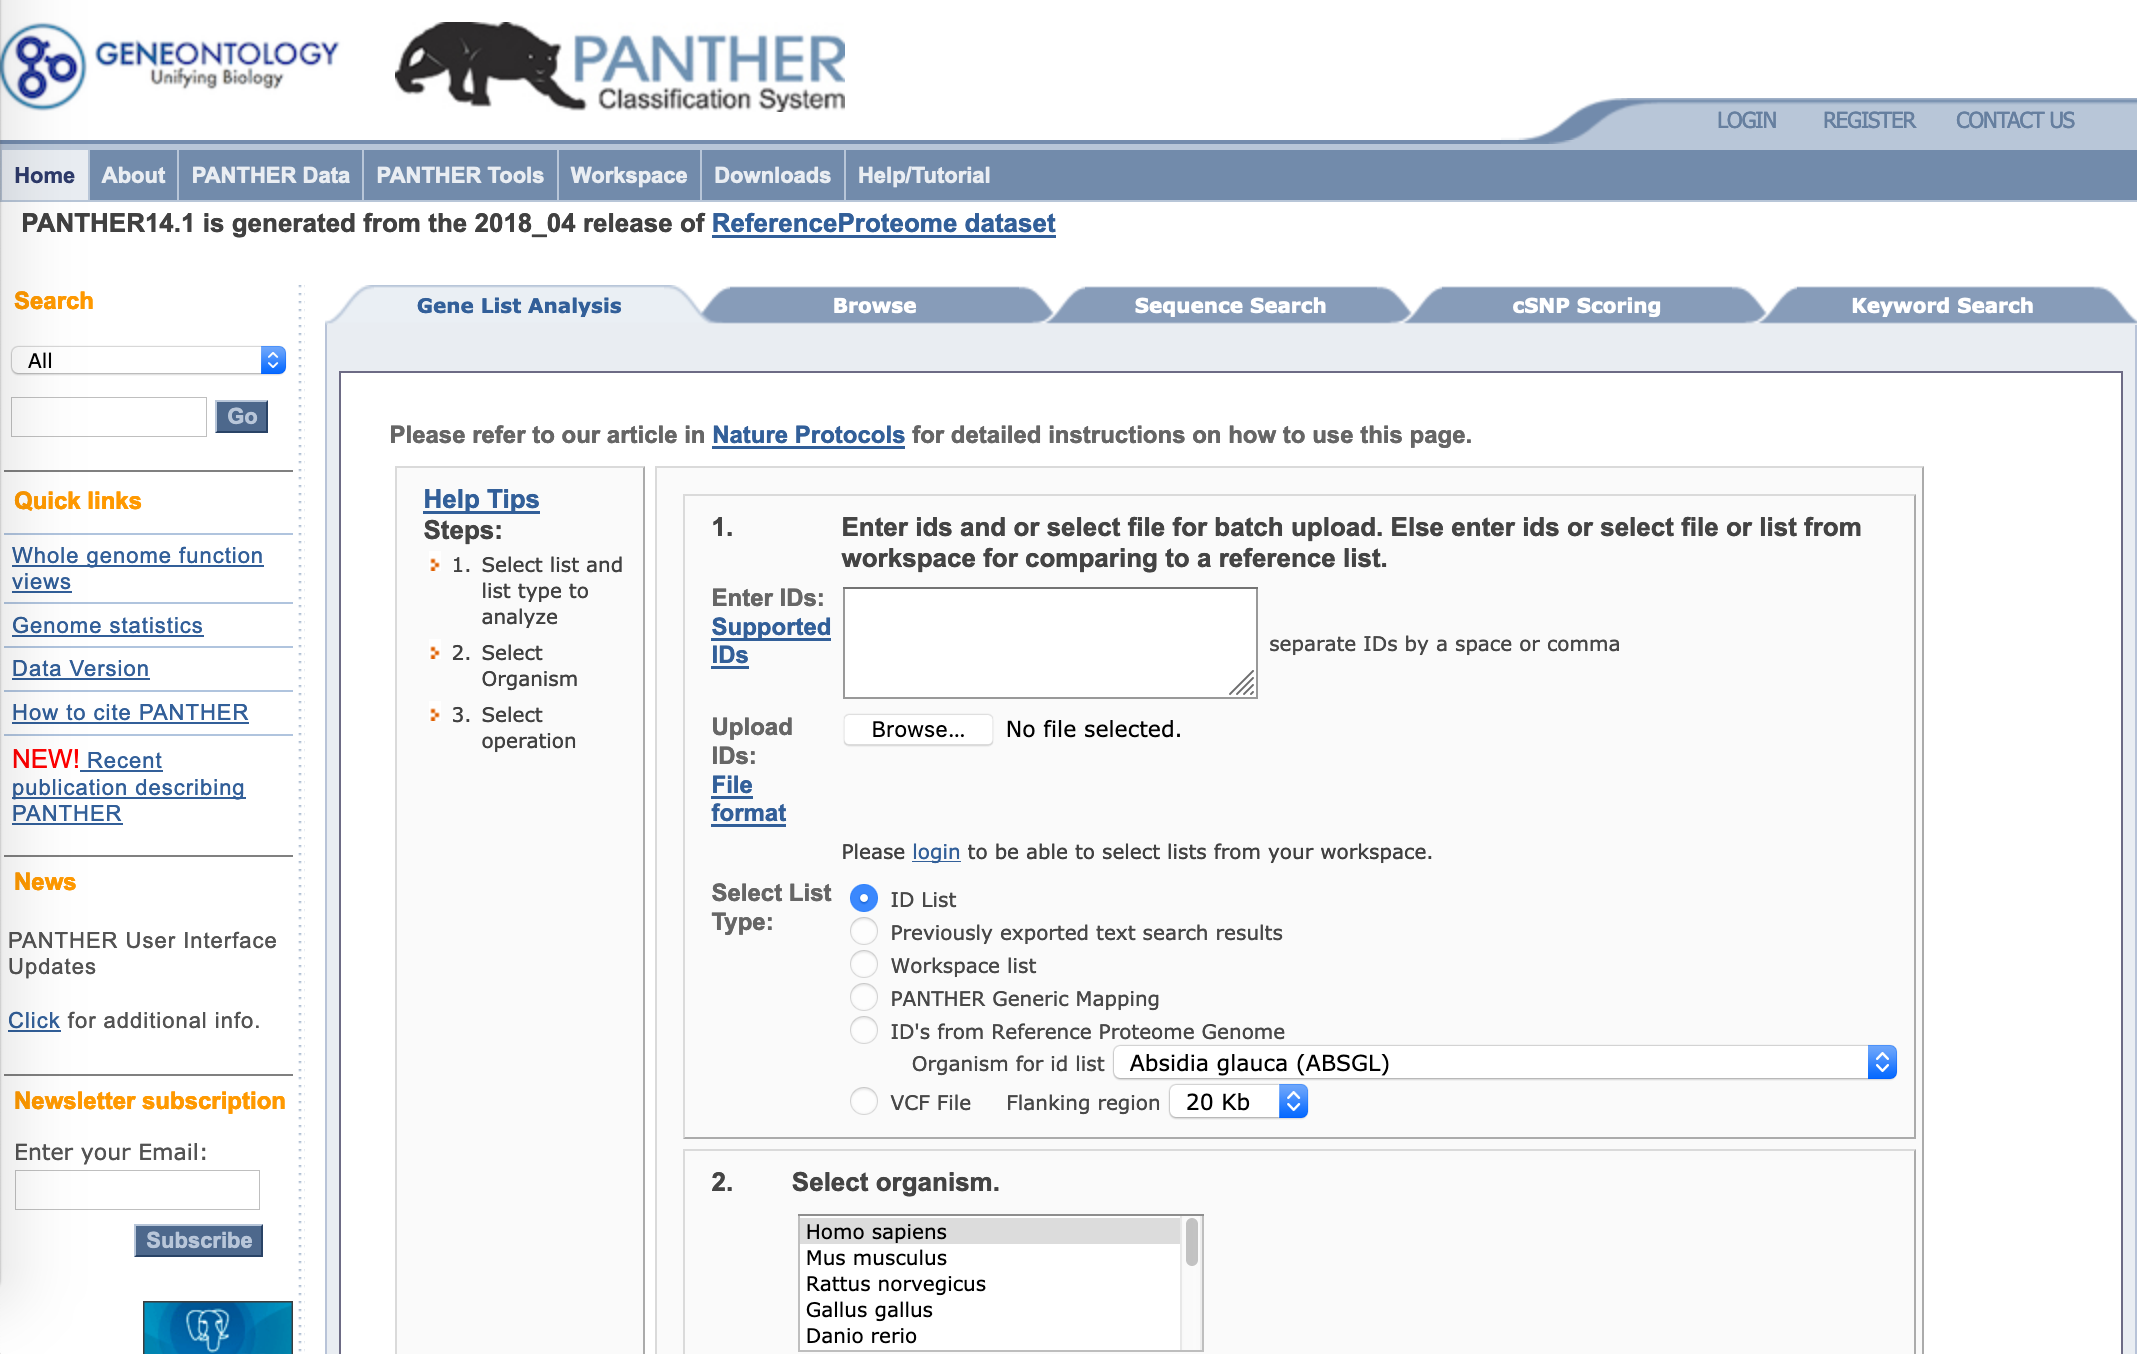
Figure 9.2: PANTHER
9.2.3 DAVID
Via its ‘functional annotation’ tool, DAVID allows you to calculate functional enrichment across a number of databases, including Gene Ontology, KEGG, Reactome, and others. Reliable, with a slightly clunky interface.
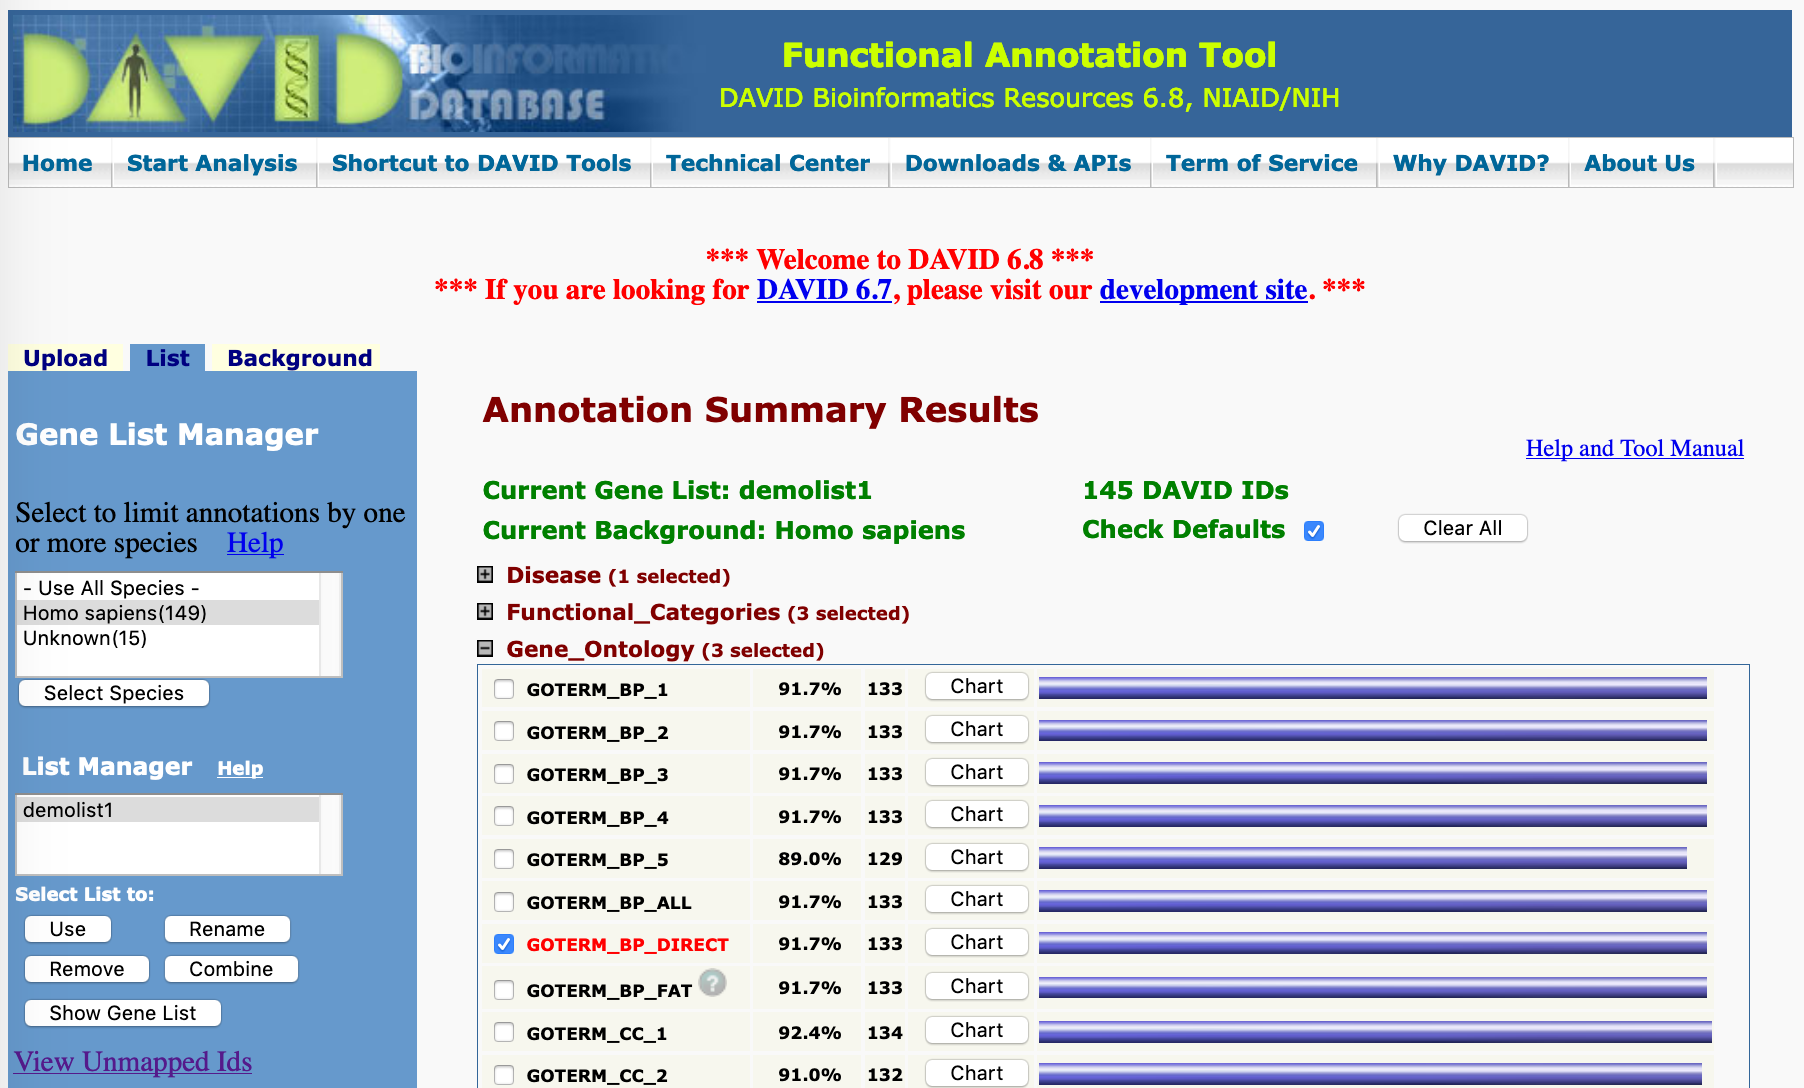
Figure 9.3: DAVID
9.2.4 Enrichr
https://amp.pharm.mssm.edu/Enrichr/
Enrichr easily calculates enrichment across a wide range of databases. It currently allows for a background set.
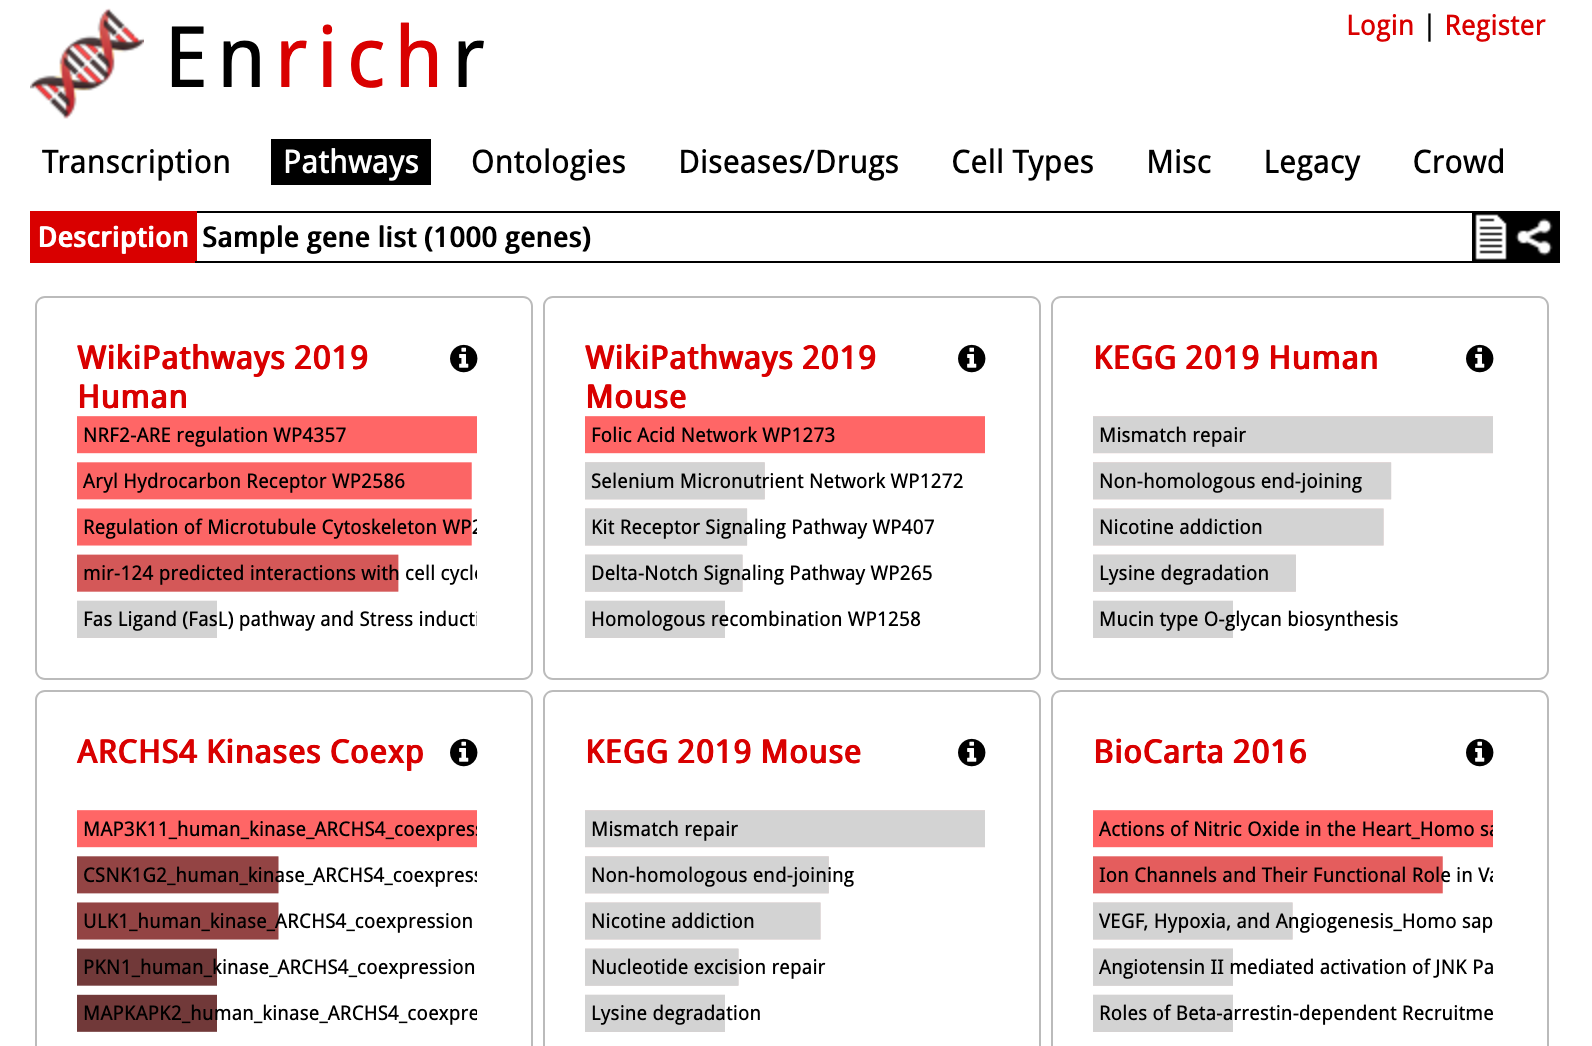
Figure 9.4: Enrichr
9.2.5 Reactome
The core of Reactome is the Reactome Pathway Browser. Although other tools use the Reactome database, the Reactome website provides a means to browse enrichment within the pathway browser view.
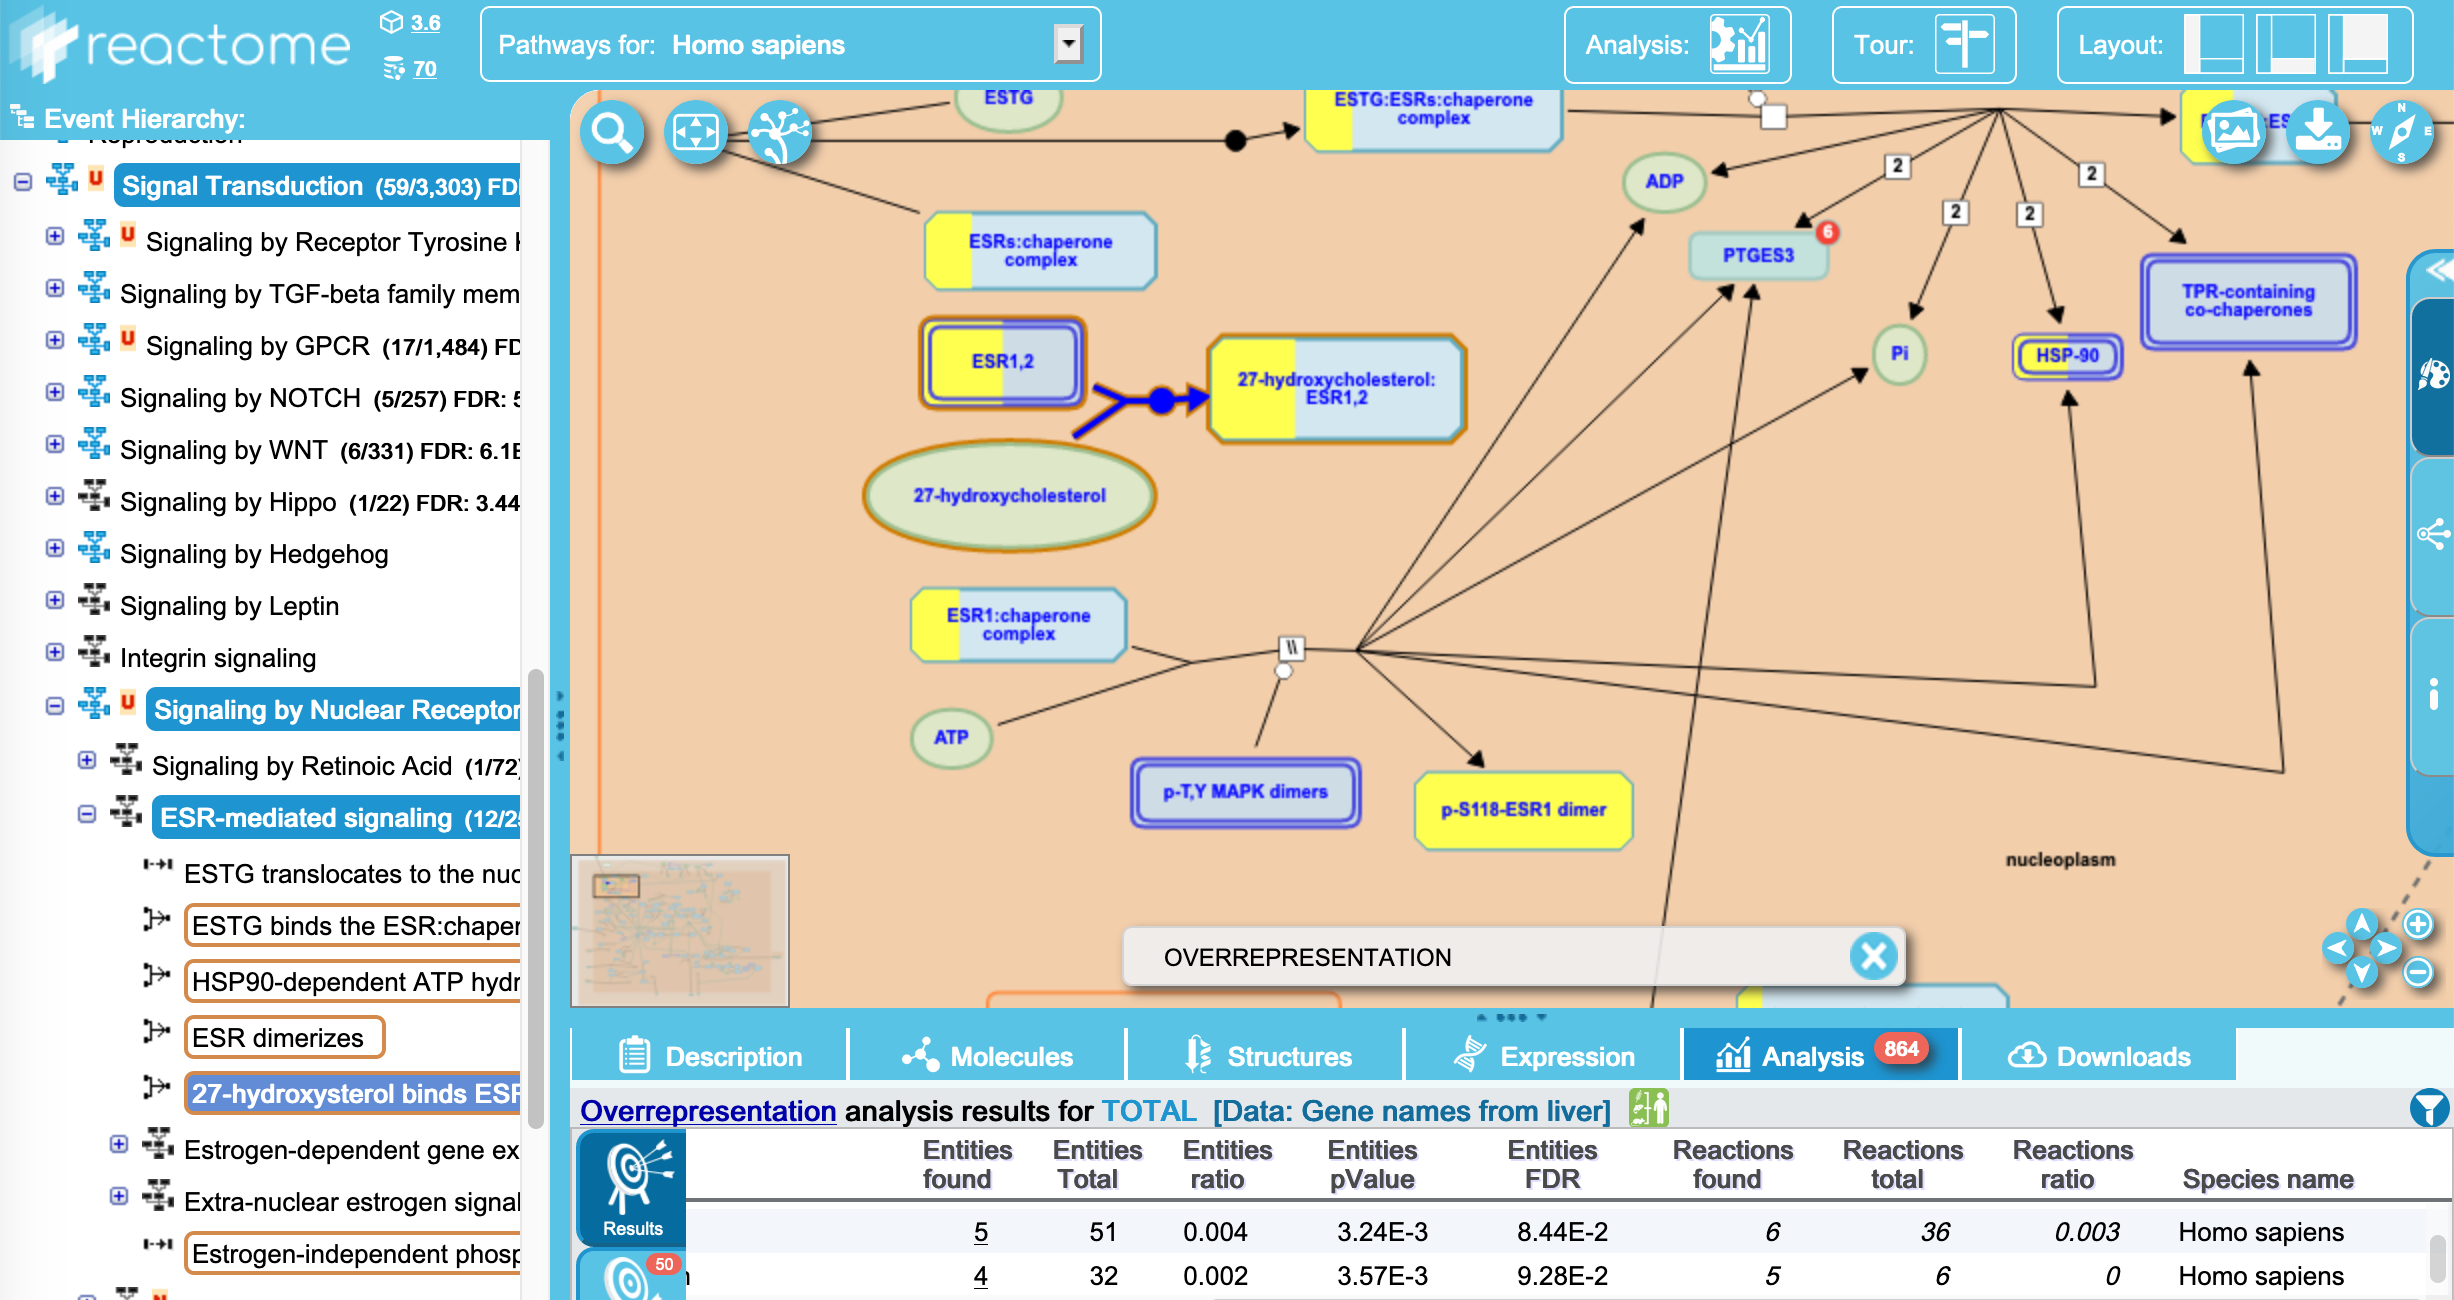
Figure 9.5: Reactome
9.2.6 BioCyc
BioCyc is another suite of tools for enrichment and pathway browsing, particularly useful for prokaryotic studies. It is a licensed resource, but Monash holds an institutional licence.
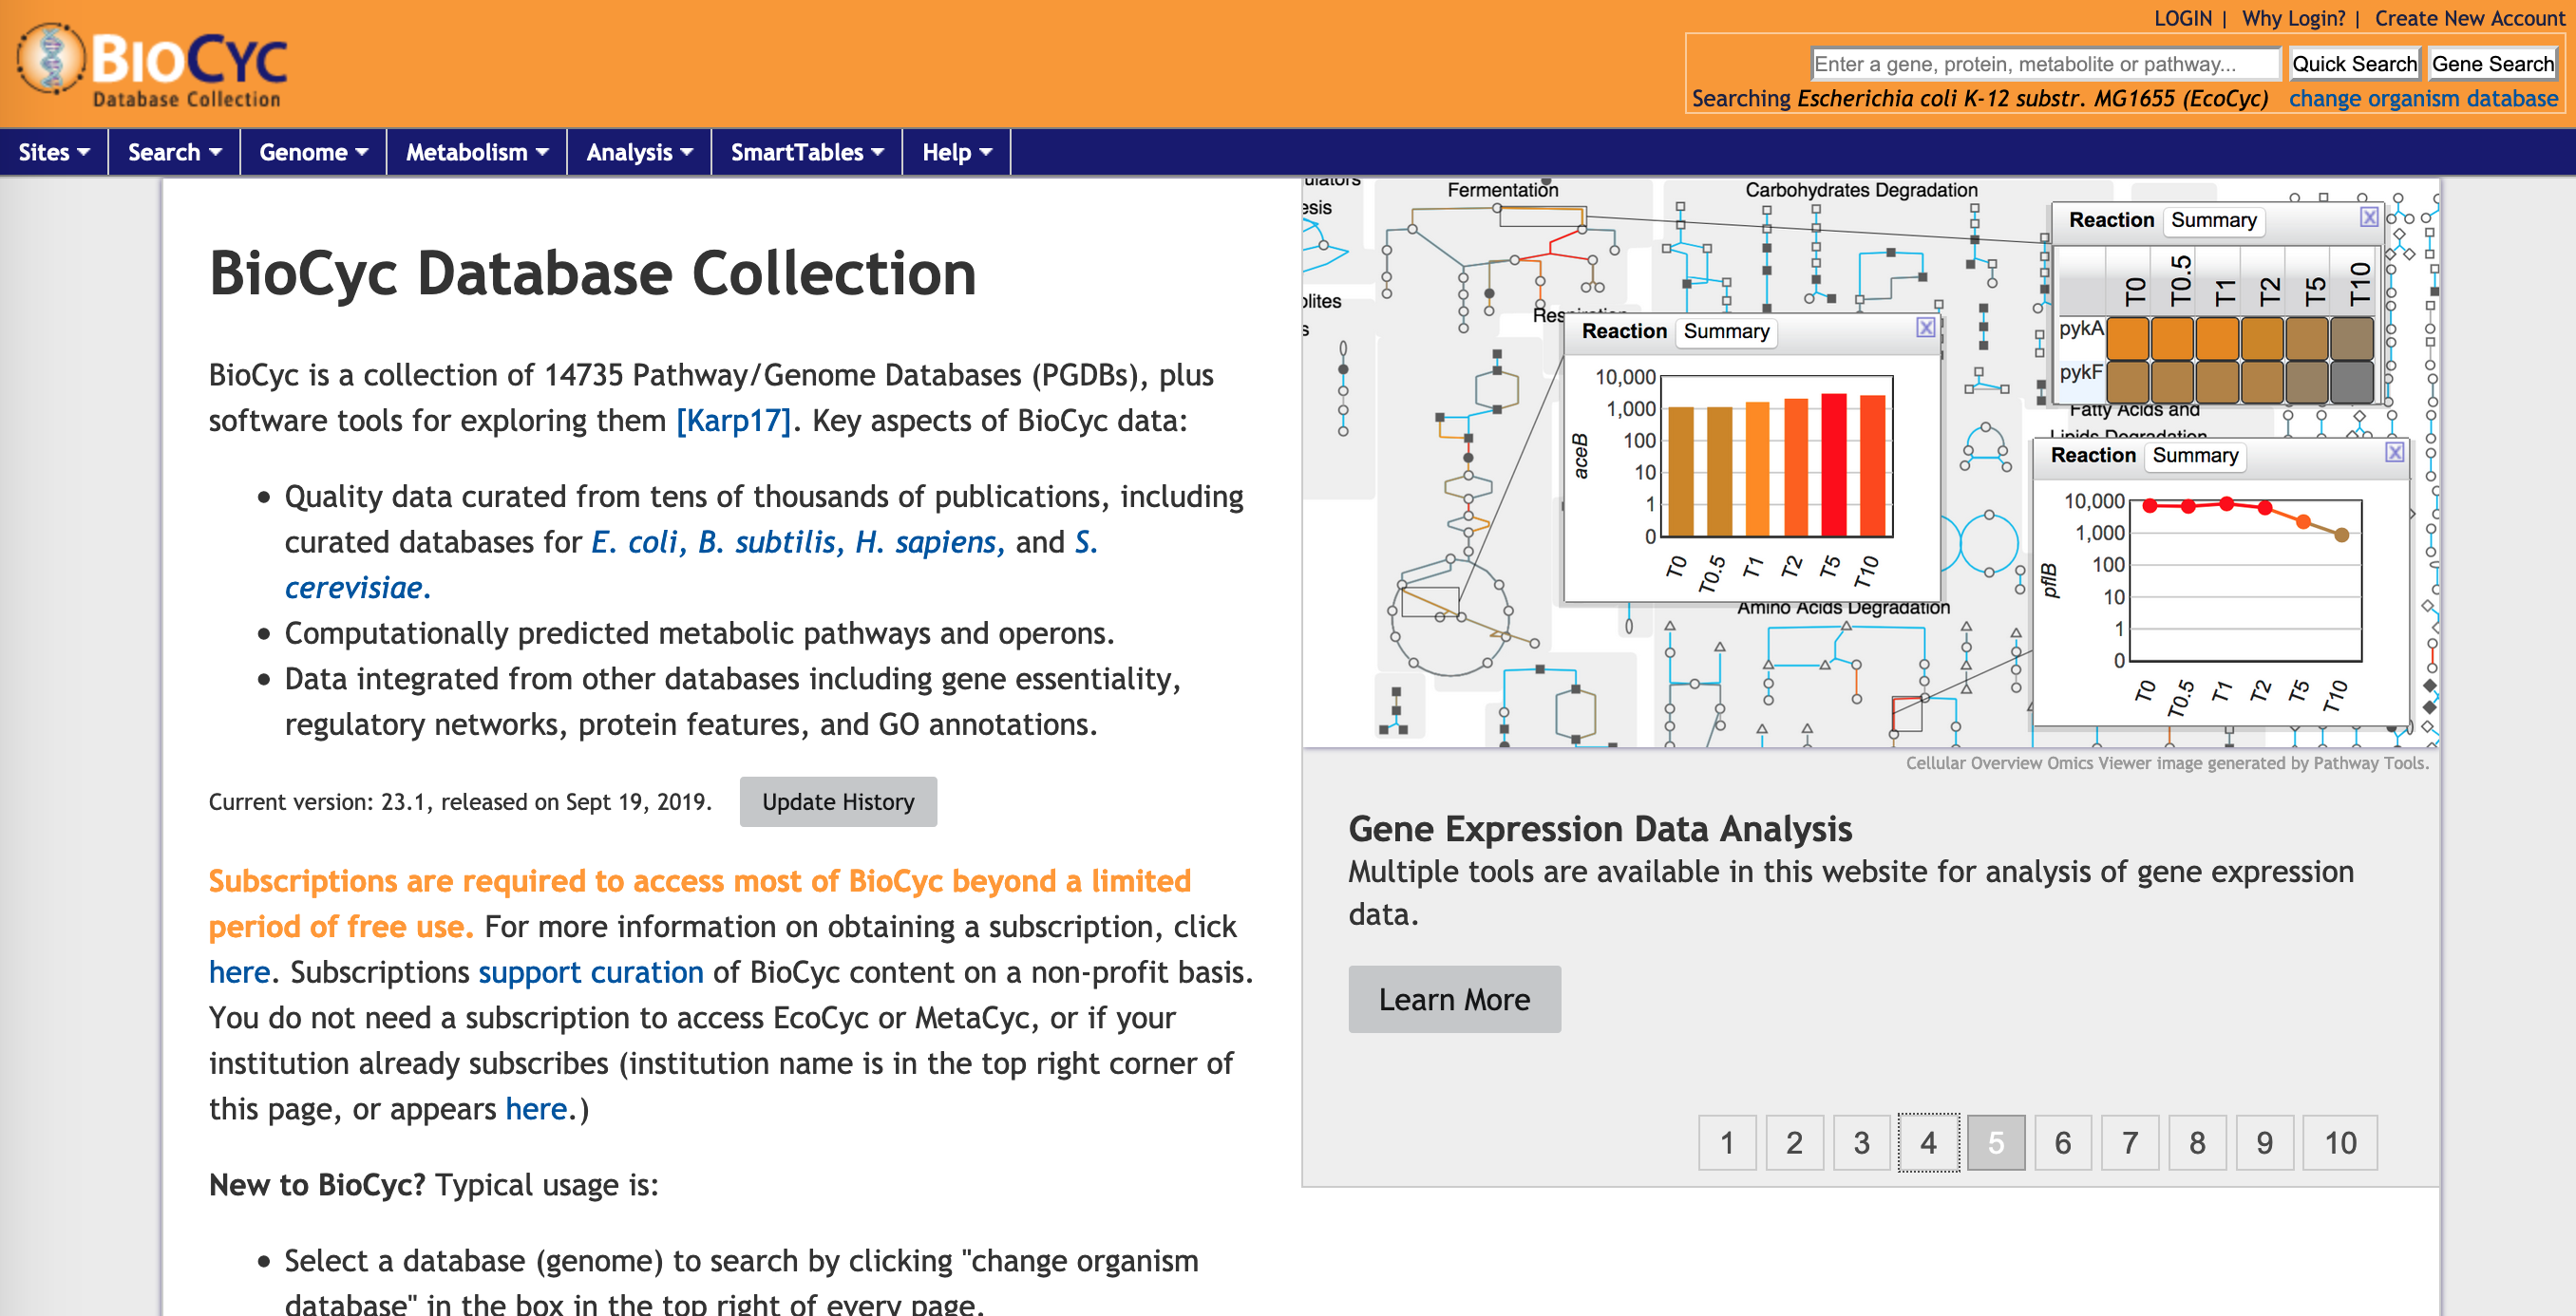
Figure 9.6: Biocyc
9.2.7 STRING
STRING was originally designed as a convenient tool to explore interactions within a gene list, visualised as an interaction network. While it is best suited for smaller gene lists, it now also includes functionality for performing functional enrichment analysis.
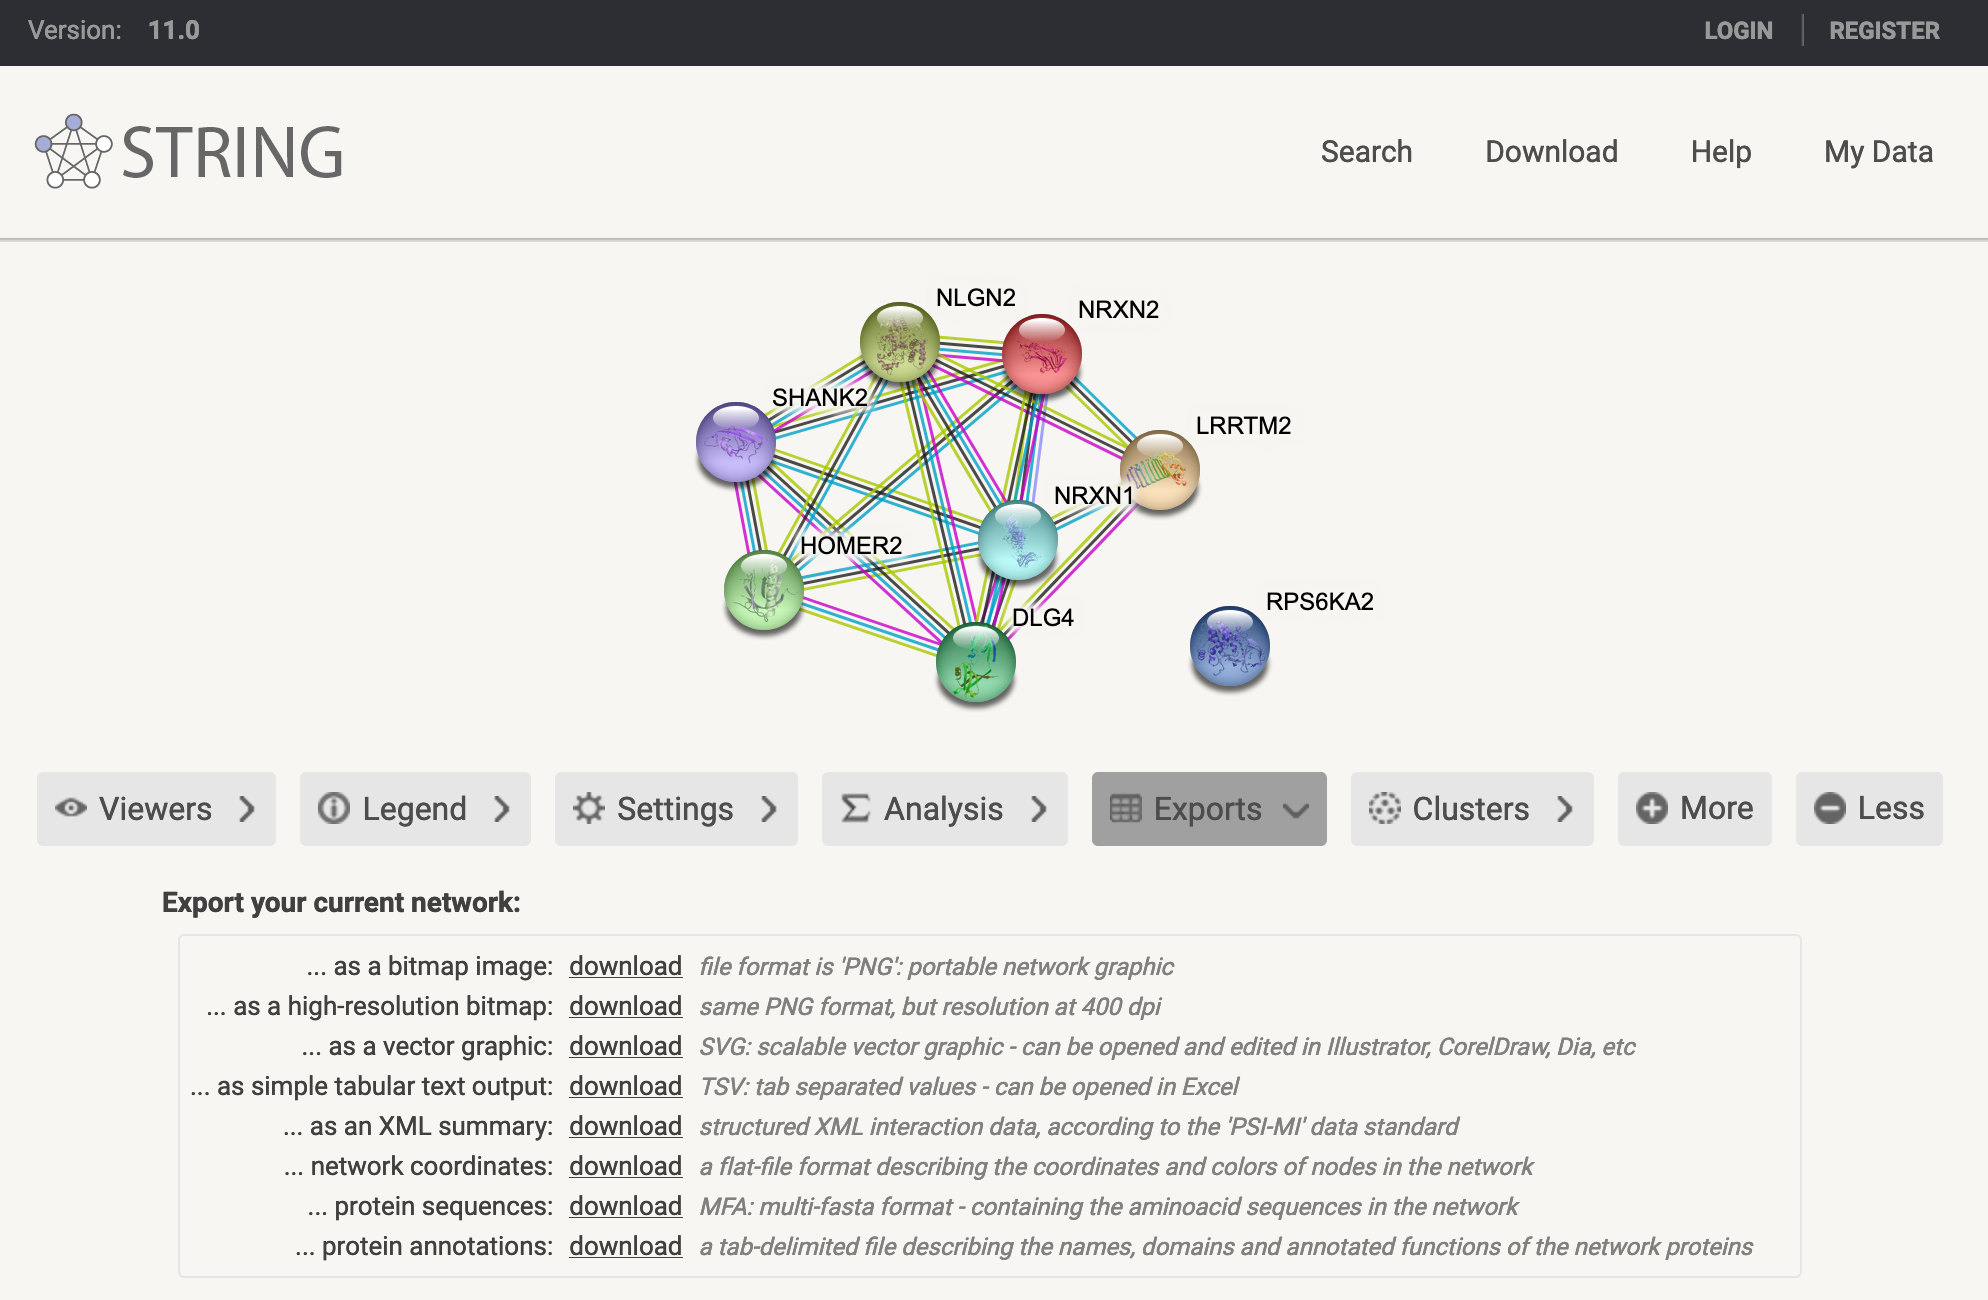
Figure 9.7: STRING
9.2.8 Gene Ontology
Gene Ontology (GO) terms are the most widely used set of functional annotations, used by many enrichment tools. The Gene Ontology resource website itself provides several tools for browsing the GO term hierarchy.
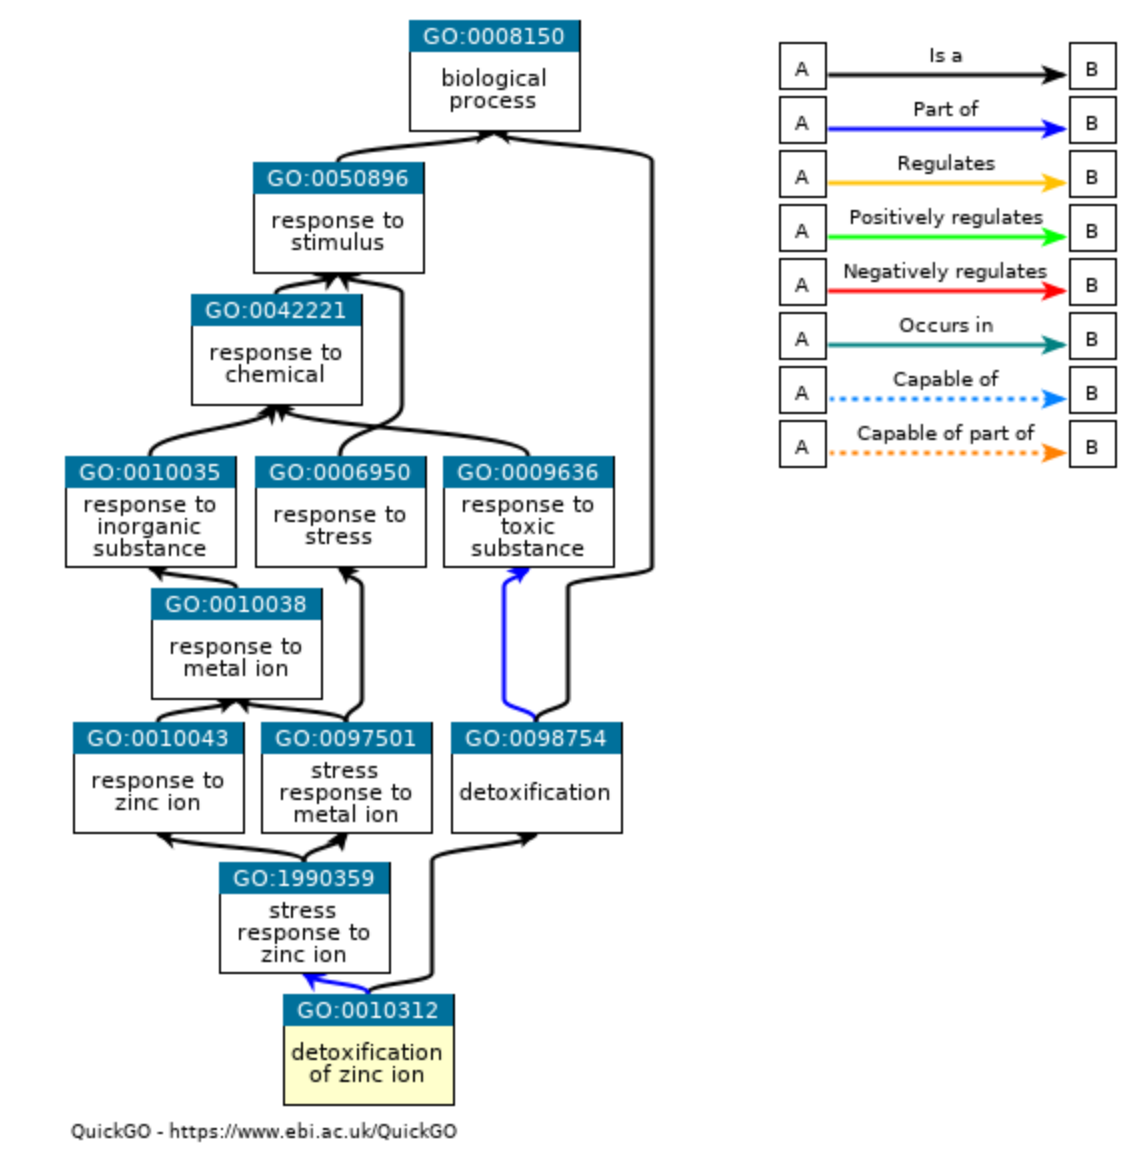
Figure 9.8: Gene Ontology
9.2.9 KEGG
A well-known curated pathway database. It is used by many other tools but with a caveat - KEGG moved to a subscription model in 2011, and so enrichment tools need to use the last open release from 2011. However, up-to-date KEGG pathways are browsable directly through their website.
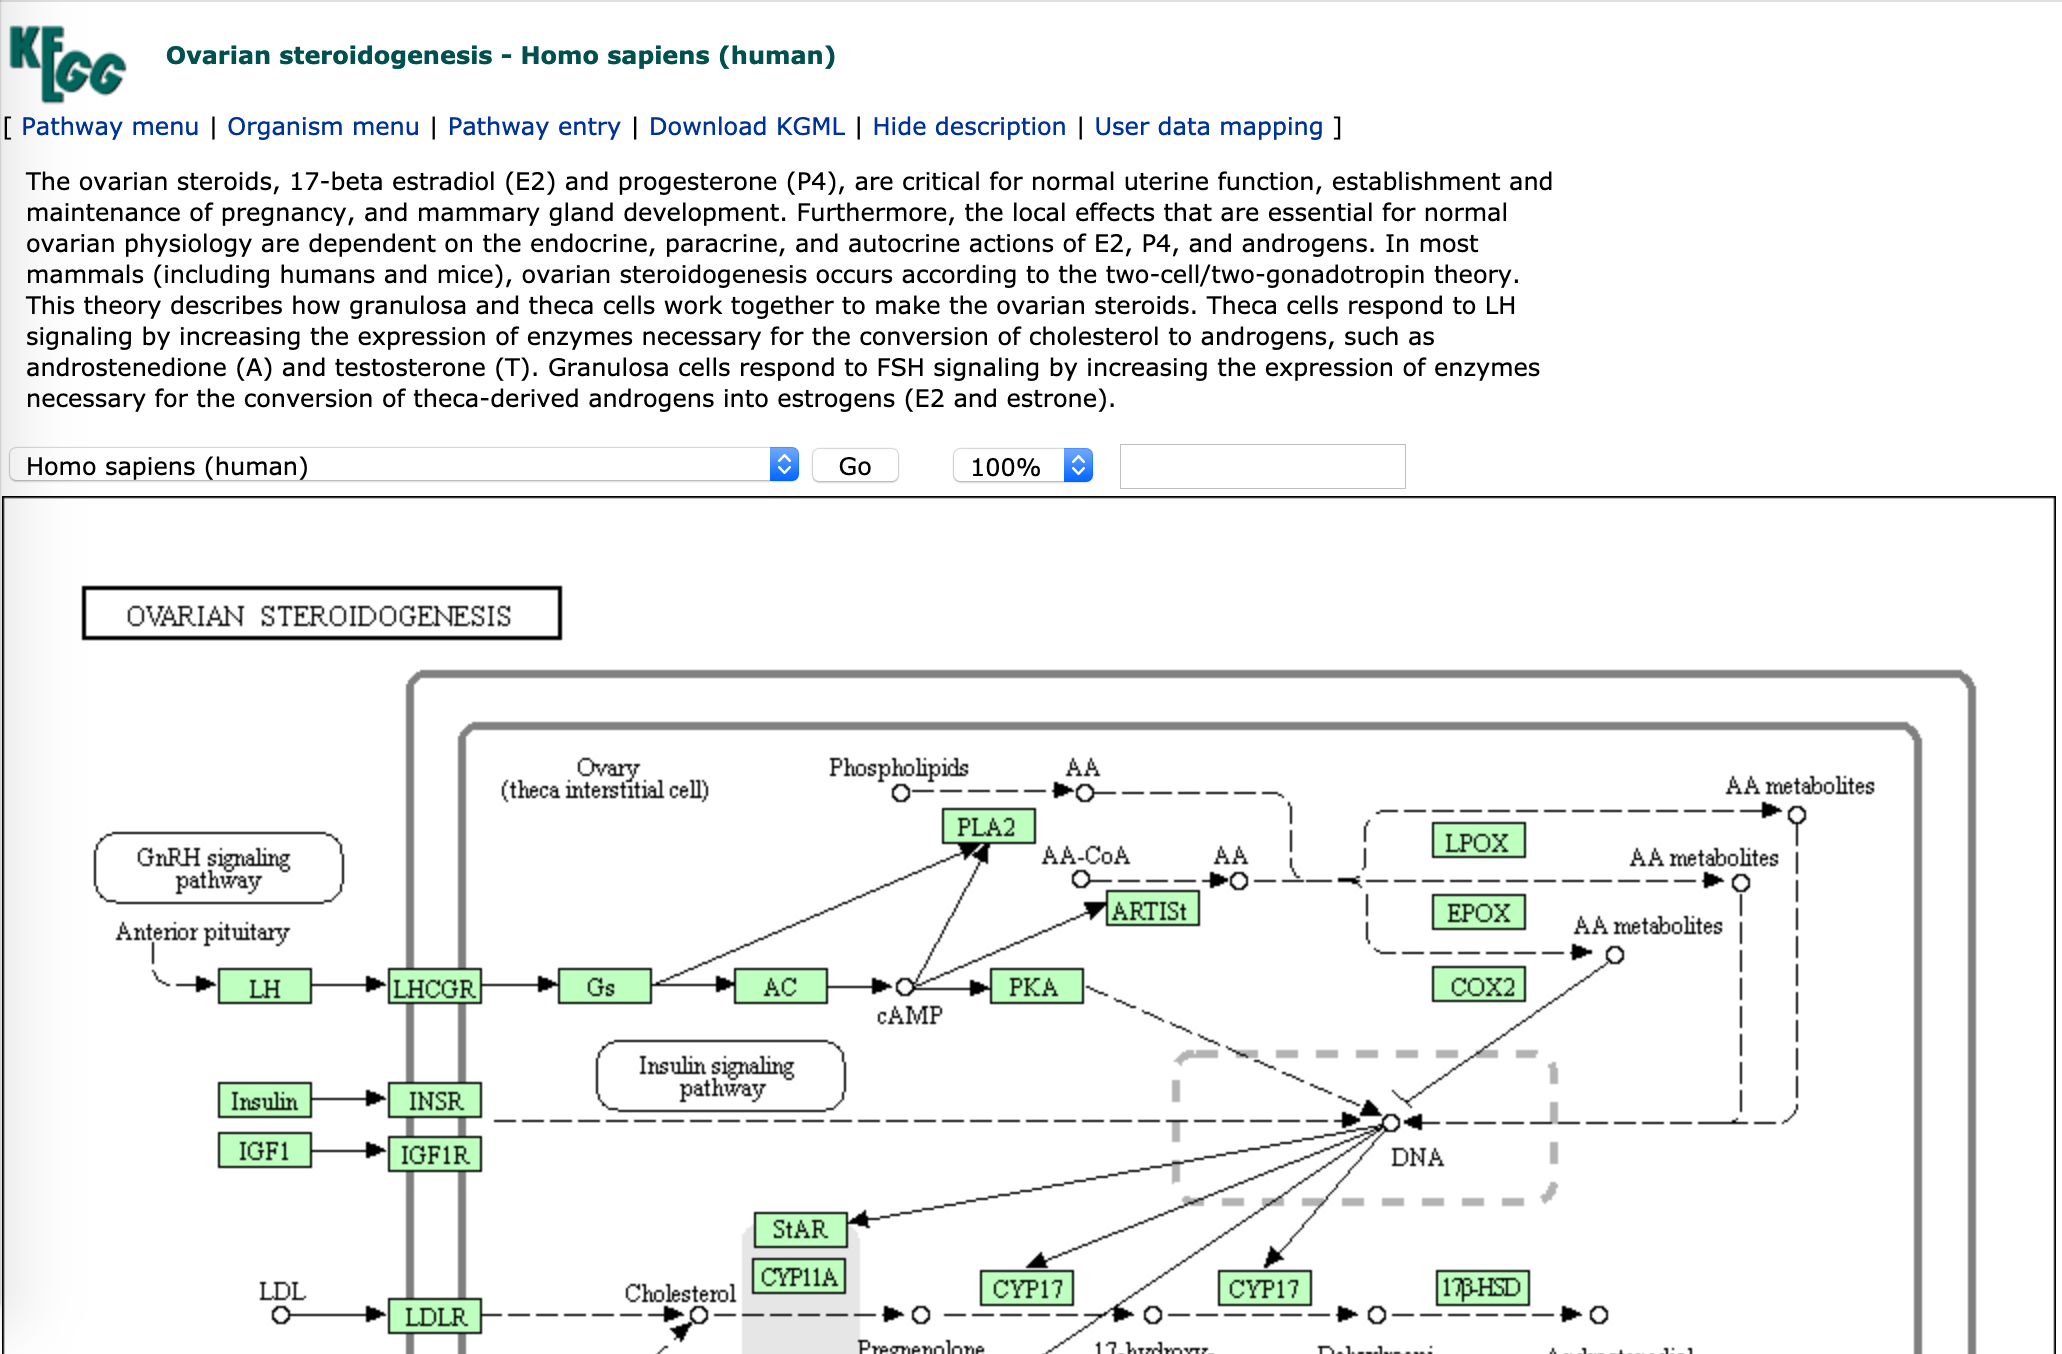
Figure 9.9: KEGG
9.2.10 GSEA and MSigDB
http://software.broadinstitute.org/gsea/index.jsp
The GSEA Desktop is (one of many) gene set enrichment approaches. It uses gene rankings across all genes rather than hypergeometric or Fisher’s exact tests of gene list enrichment. MSigDB (Molecular signatures Database) is a suite of annotation databases suitable for GSEA analysis.
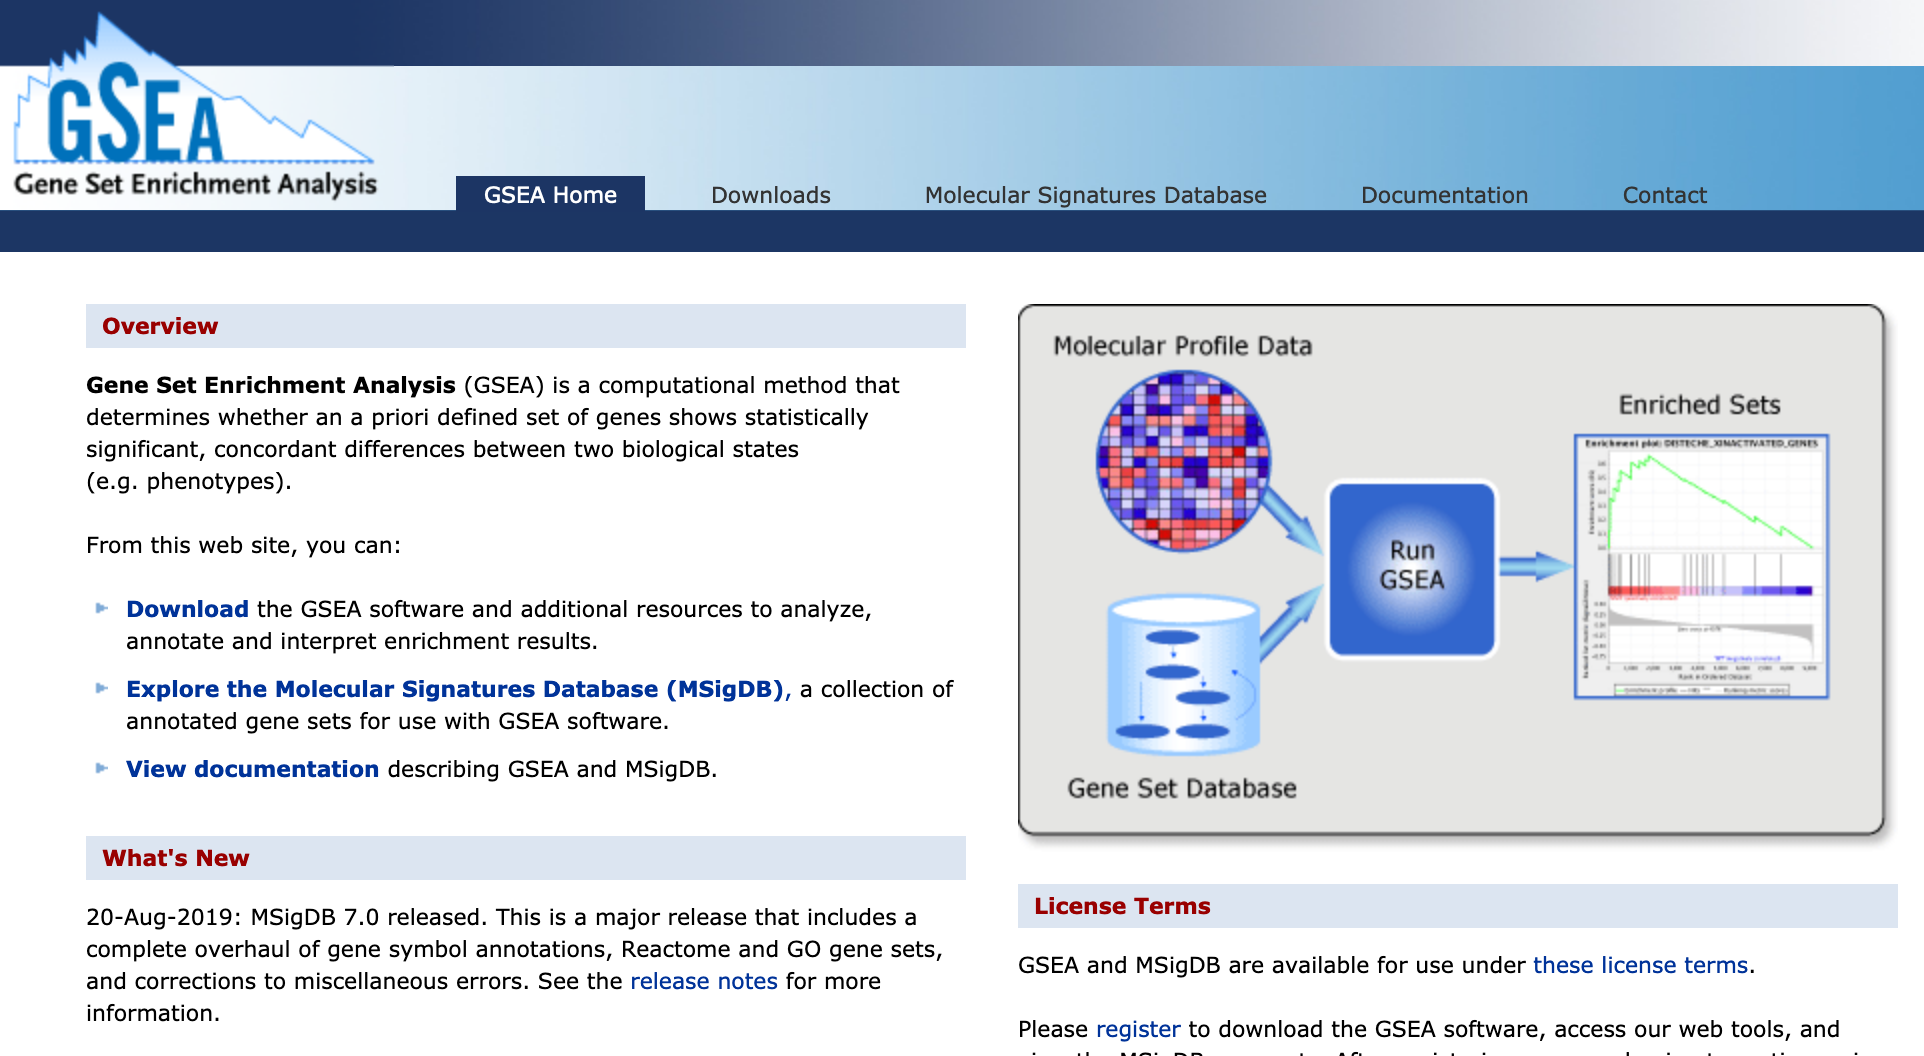
Figure 9.10: MSigDB
9.2.11 MetaboAnalyst
MetaboAnalyst is popular among the metabolomics community for statistical, functional, and integrative analyses of metabolomics data. It has features such as Enrichment Analysis, Pathway Analysis, and Network Analysis, which perform metabolite set enrichment, metabolic pathway analysis, and pathway activity prediction from MS peaks.
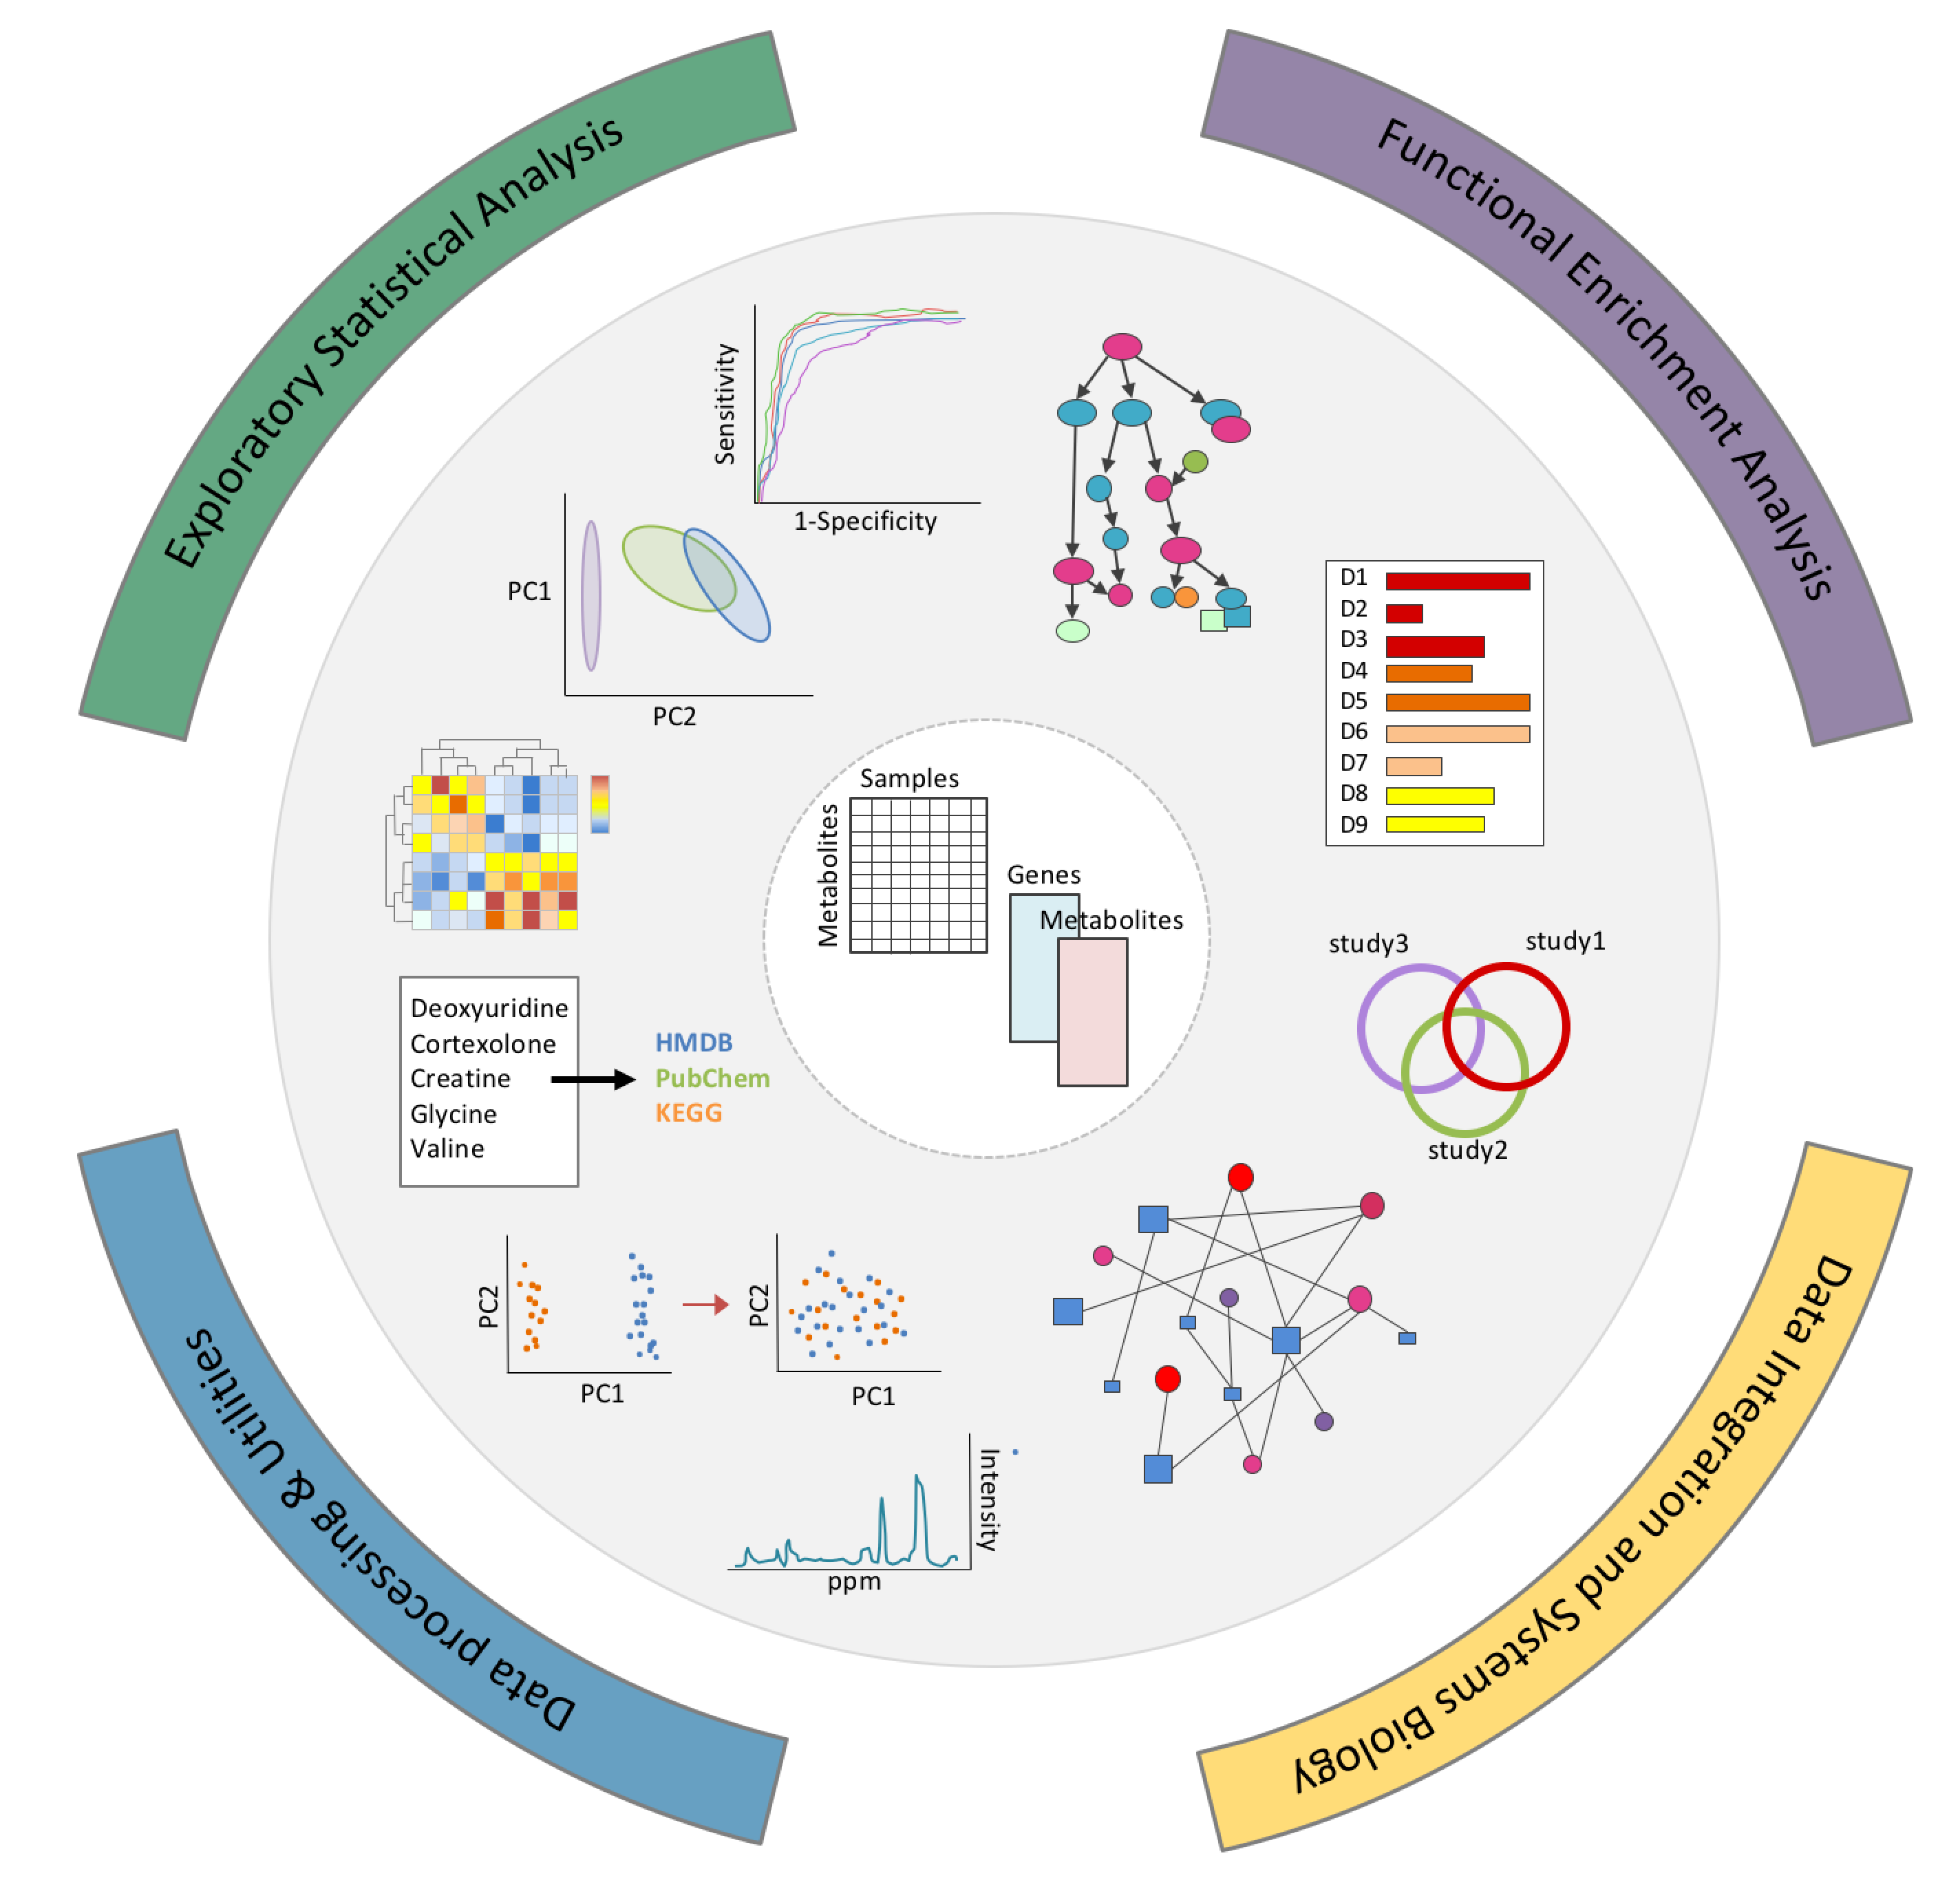
Figure 9.11: MetaboAnalyst
9.2.12 Cytoscape
Cytoscape is a desktop-based biological network analysis and visualisation tool, rather than a functional enrichment tool (although plugins can extend its functionality). It is mentioned here because it is often useful as a next step when you need to create custom figures showing the interactions of an interesting biological pathway.
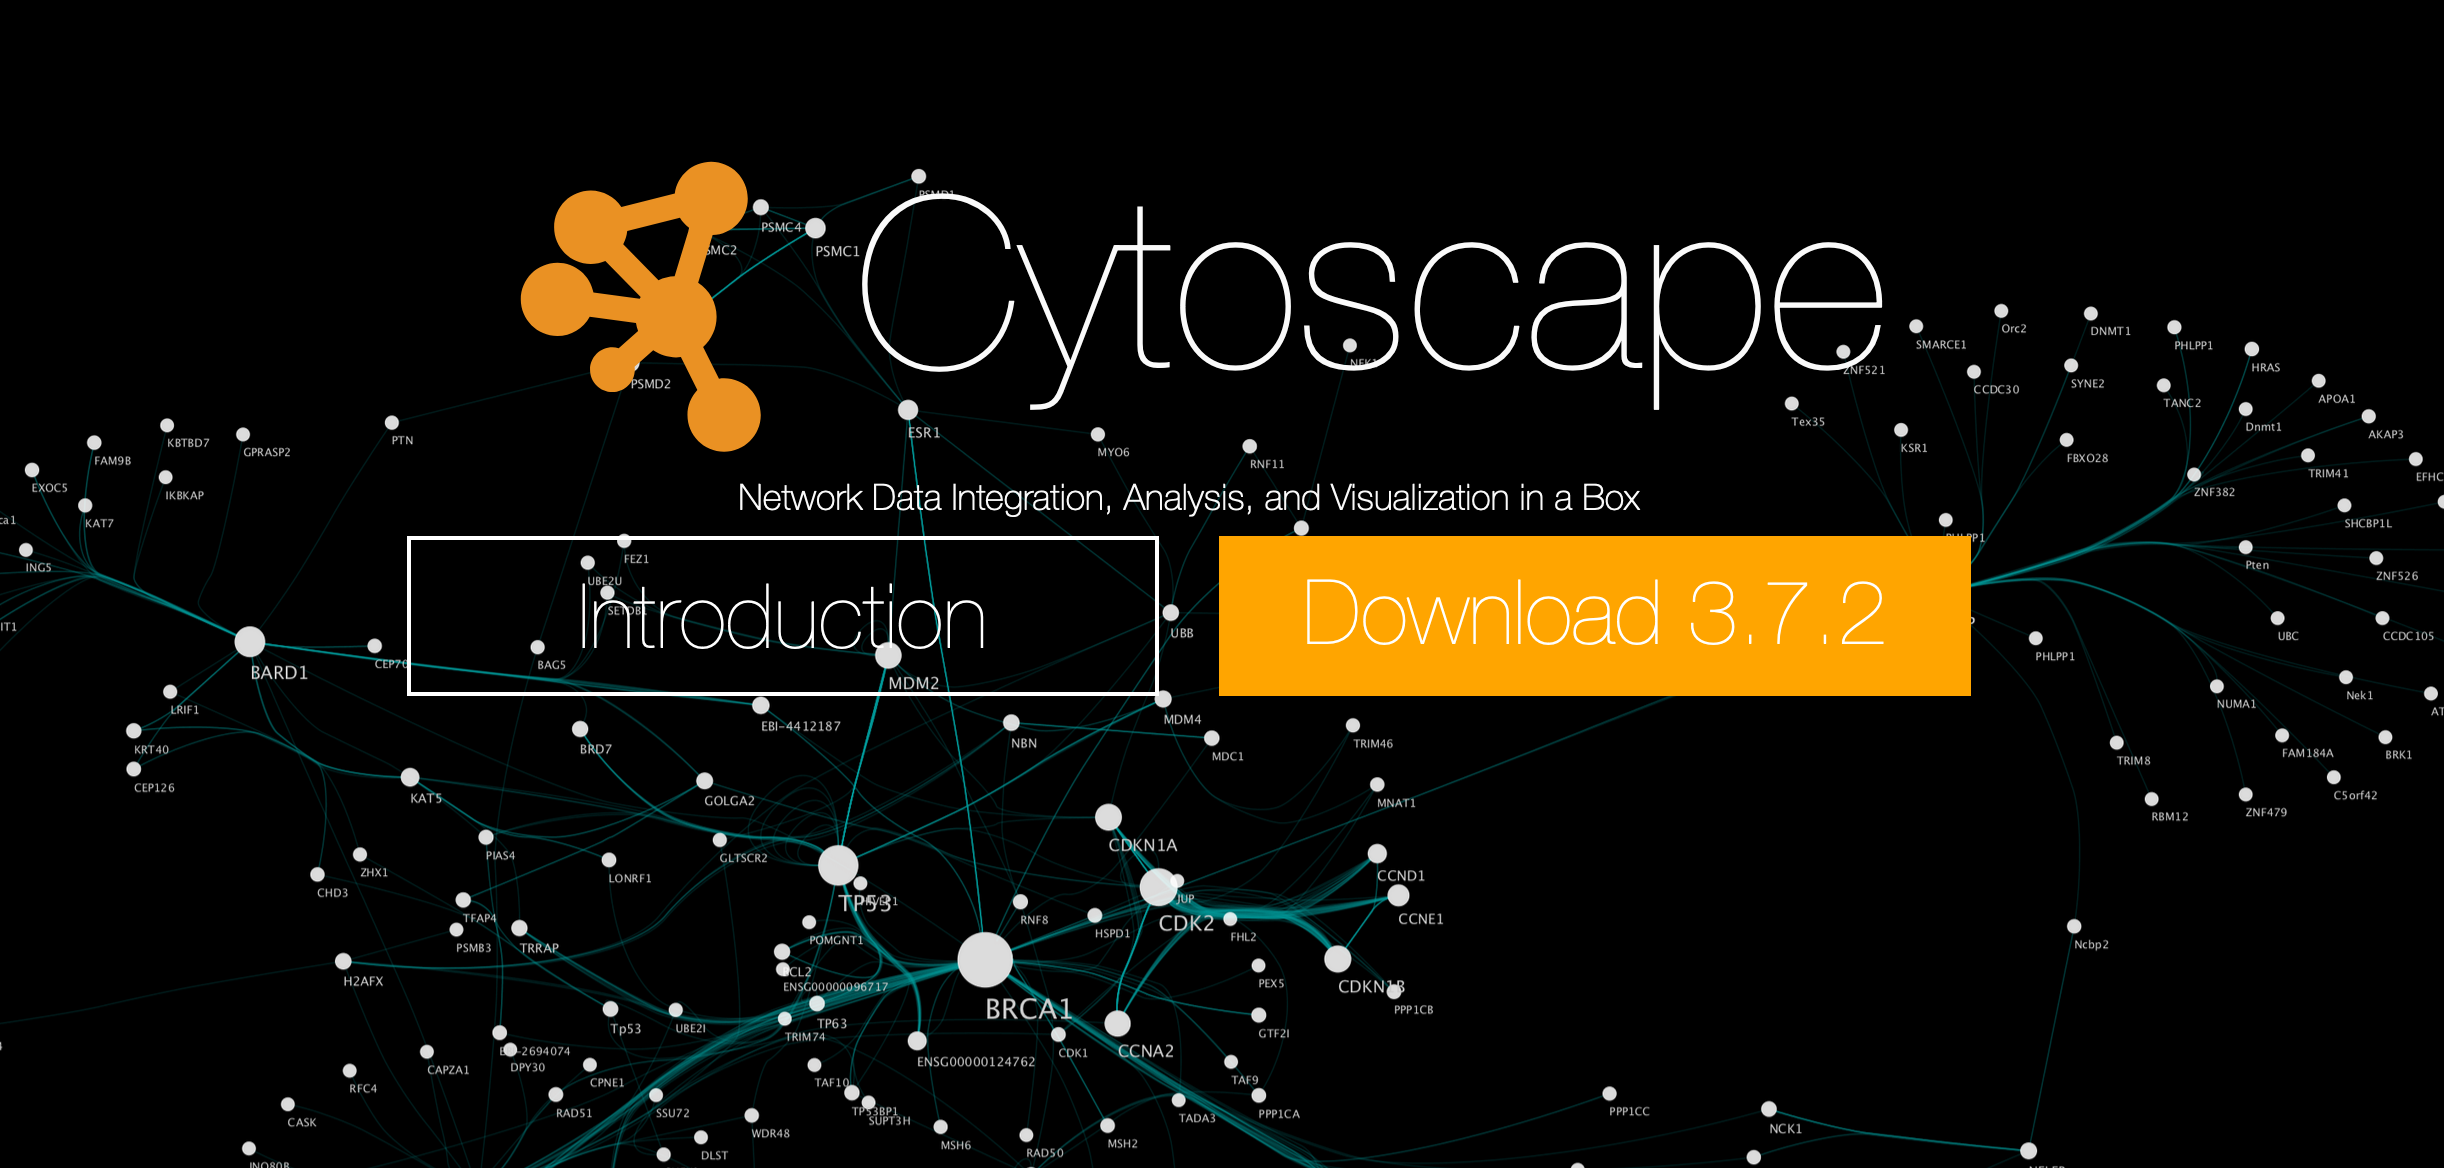
Figure 9.12: Cytoscape