10 GSEA (Standalone App)

The Broad Institute has developed a widely used stand-alone app for FCS, GSEA. They also host an extensive collection of gene-sets, the Molecular Signatures Database (MSigDB). This is a collection of gene sets representing pathways and gene signatures linked to biological states or diseases.
10.1 Running the Broad GSEA software
The GSEA app can search and download appropriate data-sets from the Broad, including gene-set databases as well as some other tables for converting gene IDs. It is free, however you must register as a user at the Broad Institute.
It can identify gene sets enriched in some experimentally determined significance / ranking metric, without any requirement to draw an arbitrary significance threshold.
10.1.1 Input files
GSEA can run in one of two modes, standard, where a normalised per-gene expression value for each sample is given; or pre-ranked, where a single value of some kind of significance score has already been calculated per gene.
For standard mode, required input files are:
- A table telling GSEA which samples belong to which condition in an accepted format like .cls.
- Normalised gene expression values such as CPM, TPM, or FPKM values, in an accepted format like .gct or .res.
For pre-ranked mode, required input files are:
- Experimental gene-expression data, either “pre-ranked” (each gene contains one pre-calculated numerical metric of significance
For both modes, also required are:
- Gene-set information e.g. in a .gmt file.
- Gene ID look-up information e.g. in a chip file, to relate the gene IDs in the experimental data to IDs in the gene-set tables.
Alternative input file formats are also accepted as described here.
10.1.2 Basic Parameters
- Create both .gct and .cls files following this script in R
- Under the “load data” menu, import the .gct (gene expression data) and .cls (phenotype labels) files
- Click run GSEA (or to use your pre-calculated metric, run GSEAPreranked)
- Select your .gct file from the expression dataset tab
- Select your .gct file from the phenotype labels tab
- Select a .gmt file (Gene Matrix Transposed) from the gene sets database tab (downloads from Broad)
- Select an appropriate Gene ID look-up table (DNA Chip annotation file) from chip platform tab. Here we have ensembl IDs so Human_Ensembl_Gene_ID_MSigDB.v2026.1.Hs.chip should work to convert to Gene-Symbol names to match the gene set database IDs.
- Set permutation number under number of permutations tab
- Type of the permutation to be set under permutation type tab (usually “gene set” unless you have many replicates)
- Name the output name and folder in analysis name and save results in this folder tabs
10.1.3 Advanced Parameters
- Scoring Scheme:
K-S: The score increment is the same for all genes in S regardless of their ranking or correlation strength.
Weighted: the score increment for each gene in S is weighted by its correlation with the phenotype, typically the absolute value of the correlation or ranking metric.
- Metric for ranking genes: Ranking metric of interest can be chosen from drop down menu. A detailed description of the metrics is given on GSEA-MSigDB Documentation.
Categorical Phenotypes: Signal-to-Noise Ratio, t-Test, Ratio of Classes, Log2 Ratio of Classes
Continuous Phenotypes: Pearson Correlation, Spearman Correlation
- Minimum and Maximum size of gene sets can be set using max gene set size and min gene set size tabs
10.1.4 Browse the GSEA results
Once the job has been queued and successfully run, the output will be listed on the left panel under Jobs tab:
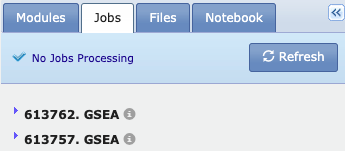
Of the most important files is the .zip file that was earlier specified under output file name tab in Basic parameters section which includes all the results. The results can also be navigated using the single files listed under the job id.
A good place to start is the index.html file which should contain an html menu where we can navigate to whichever results are of interest.
For Pezzini experiment, two html files generated for each of up- and down-regulated gene sets, something like:
gsea_report_for_Diff_1731388275794.html
gsea_report_for_Nodiff_1731388275794.html
The tabulated versions of the results are given in .tsv format:
gsea_report_for_Diff_1731388275794.tsv
gsea_report_for_Nodiff_1731388275794.tsv
The GSEA result tables have the following header and below is given details of one gene set:
The leading edge column has three values:
- tags: 38% of the genes in the gene set are key to the enrichment result.
- list: These genes make up 7% of the total gene list being analyzed.
- signal: They contribute 40% of the enrichment signal, highlighting their importance in driving the association between this gene set and the biological phenotype being studied.
Challenge: How do different ranking metrics impact the output?
Run GSEA analysis using Hallmark gene sets with two metrics (tTest and Ratio_of_Classes). What are the upregulated terms (FDR < 0.1) in the Diff class, based on the t-test and Ratio of Classes metrics?
Question
Why might the HALLMARK_CHOLESTEROL_HOMEOSTASIS gene set be upregulated specifically in the differentiation condition of SH-SY5Y cells in Pezzini, et al 2016 experiment?
Show
- Relevance: Cholesterol is essential for neuronal function and membrane fluidity, particularly in processes like axonal growth and synapse formation. Neurons have a high demand for cholesterol, especially during differentiation when they extend axons and dendrites.
- Possible Insight: Upregulation of genes in this set could signify that differentiating cells are actively producing or transporting cholesterol to support membrane synthesis and cellular remodeling required for mature neuronal structures.