14 Reactome (web)
14.1 
Reactome is an open-source database of curated biological pathways across species, offering pathway maps and enrichment tools to analyse gene lists in a pathway-focused context. It’s ideal for visualising data within established biochemical and cellular processes.
14.1.1 Steps to perform ORA in Reactome:
- Hit the
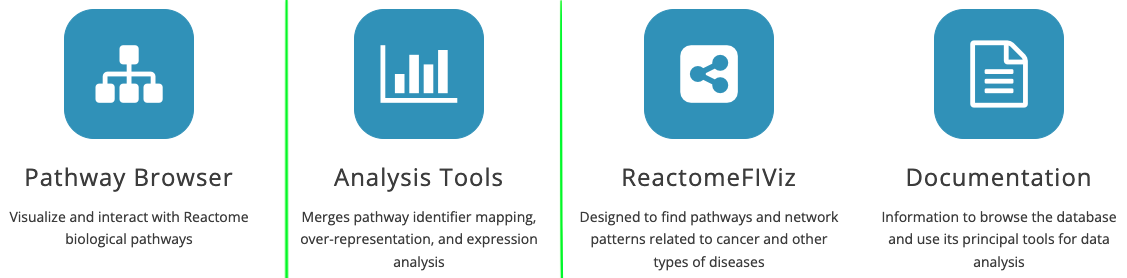
Analysis Toolstab
 - Choose
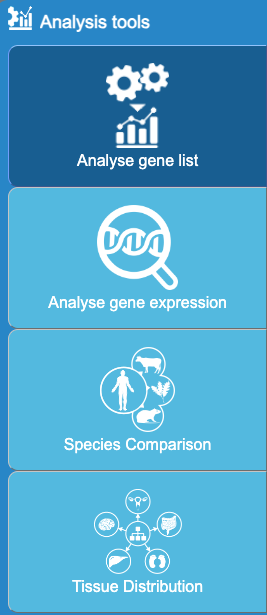
 Analyse gene list from the left panel
Upload list of features on the box or choose a file, hit continue
-
Select preferred options:
- Project to Human: This option will convert identifiers from non-human species into human equivalents, allowing you to analyse data across species.
- Include interactors: This option integrates interactors from IntAct, a protein interaction database. Including interactors broadens the background network, potentially offering deeper insights.
Hit Analyse!
14.1.2 Steps to perform GSA in Reactome:
Note: GSA appears to be non-functional at reactome.org as of August 2026.
Skip to “Browse the Reactome Results” below.
If
Analyse gene expressionwas chosen instead, Reactome offers the following gene set analysis:Let’s try CAMERA as it represents the
camera()function oflimmapackage inRfor a gene set analysis.Choose TMM normalisation to ensure consistency with the input data used in other tools within our workshop.
Select data type and provide input data
Annotate columns by adding extra info as follows:
Save dataset and Continue
You can now browse the results
14.1.3 Browse the Reactome results
Results can be interactively browsed using the reactome pathway or voronoi visualisation modes: 
User can explore the pathway names listed in the table within the Analysis tab and they are displayed as popups on the pathway diagrams.
One can also select a pathway of interest by navigating through the left panel or by simply searching for the term in the search box.
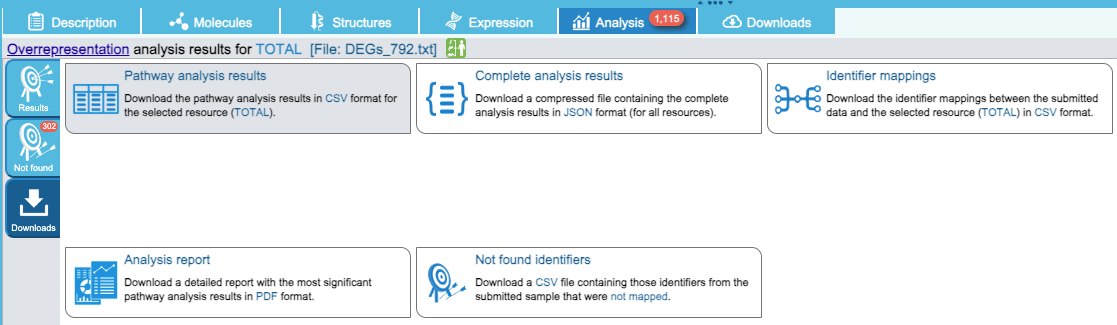
The enriched table can be downloaded as shown below:
The diagram can be downloaded using this icons: 
Here is a sample pathway diagram from Reactome GSA.
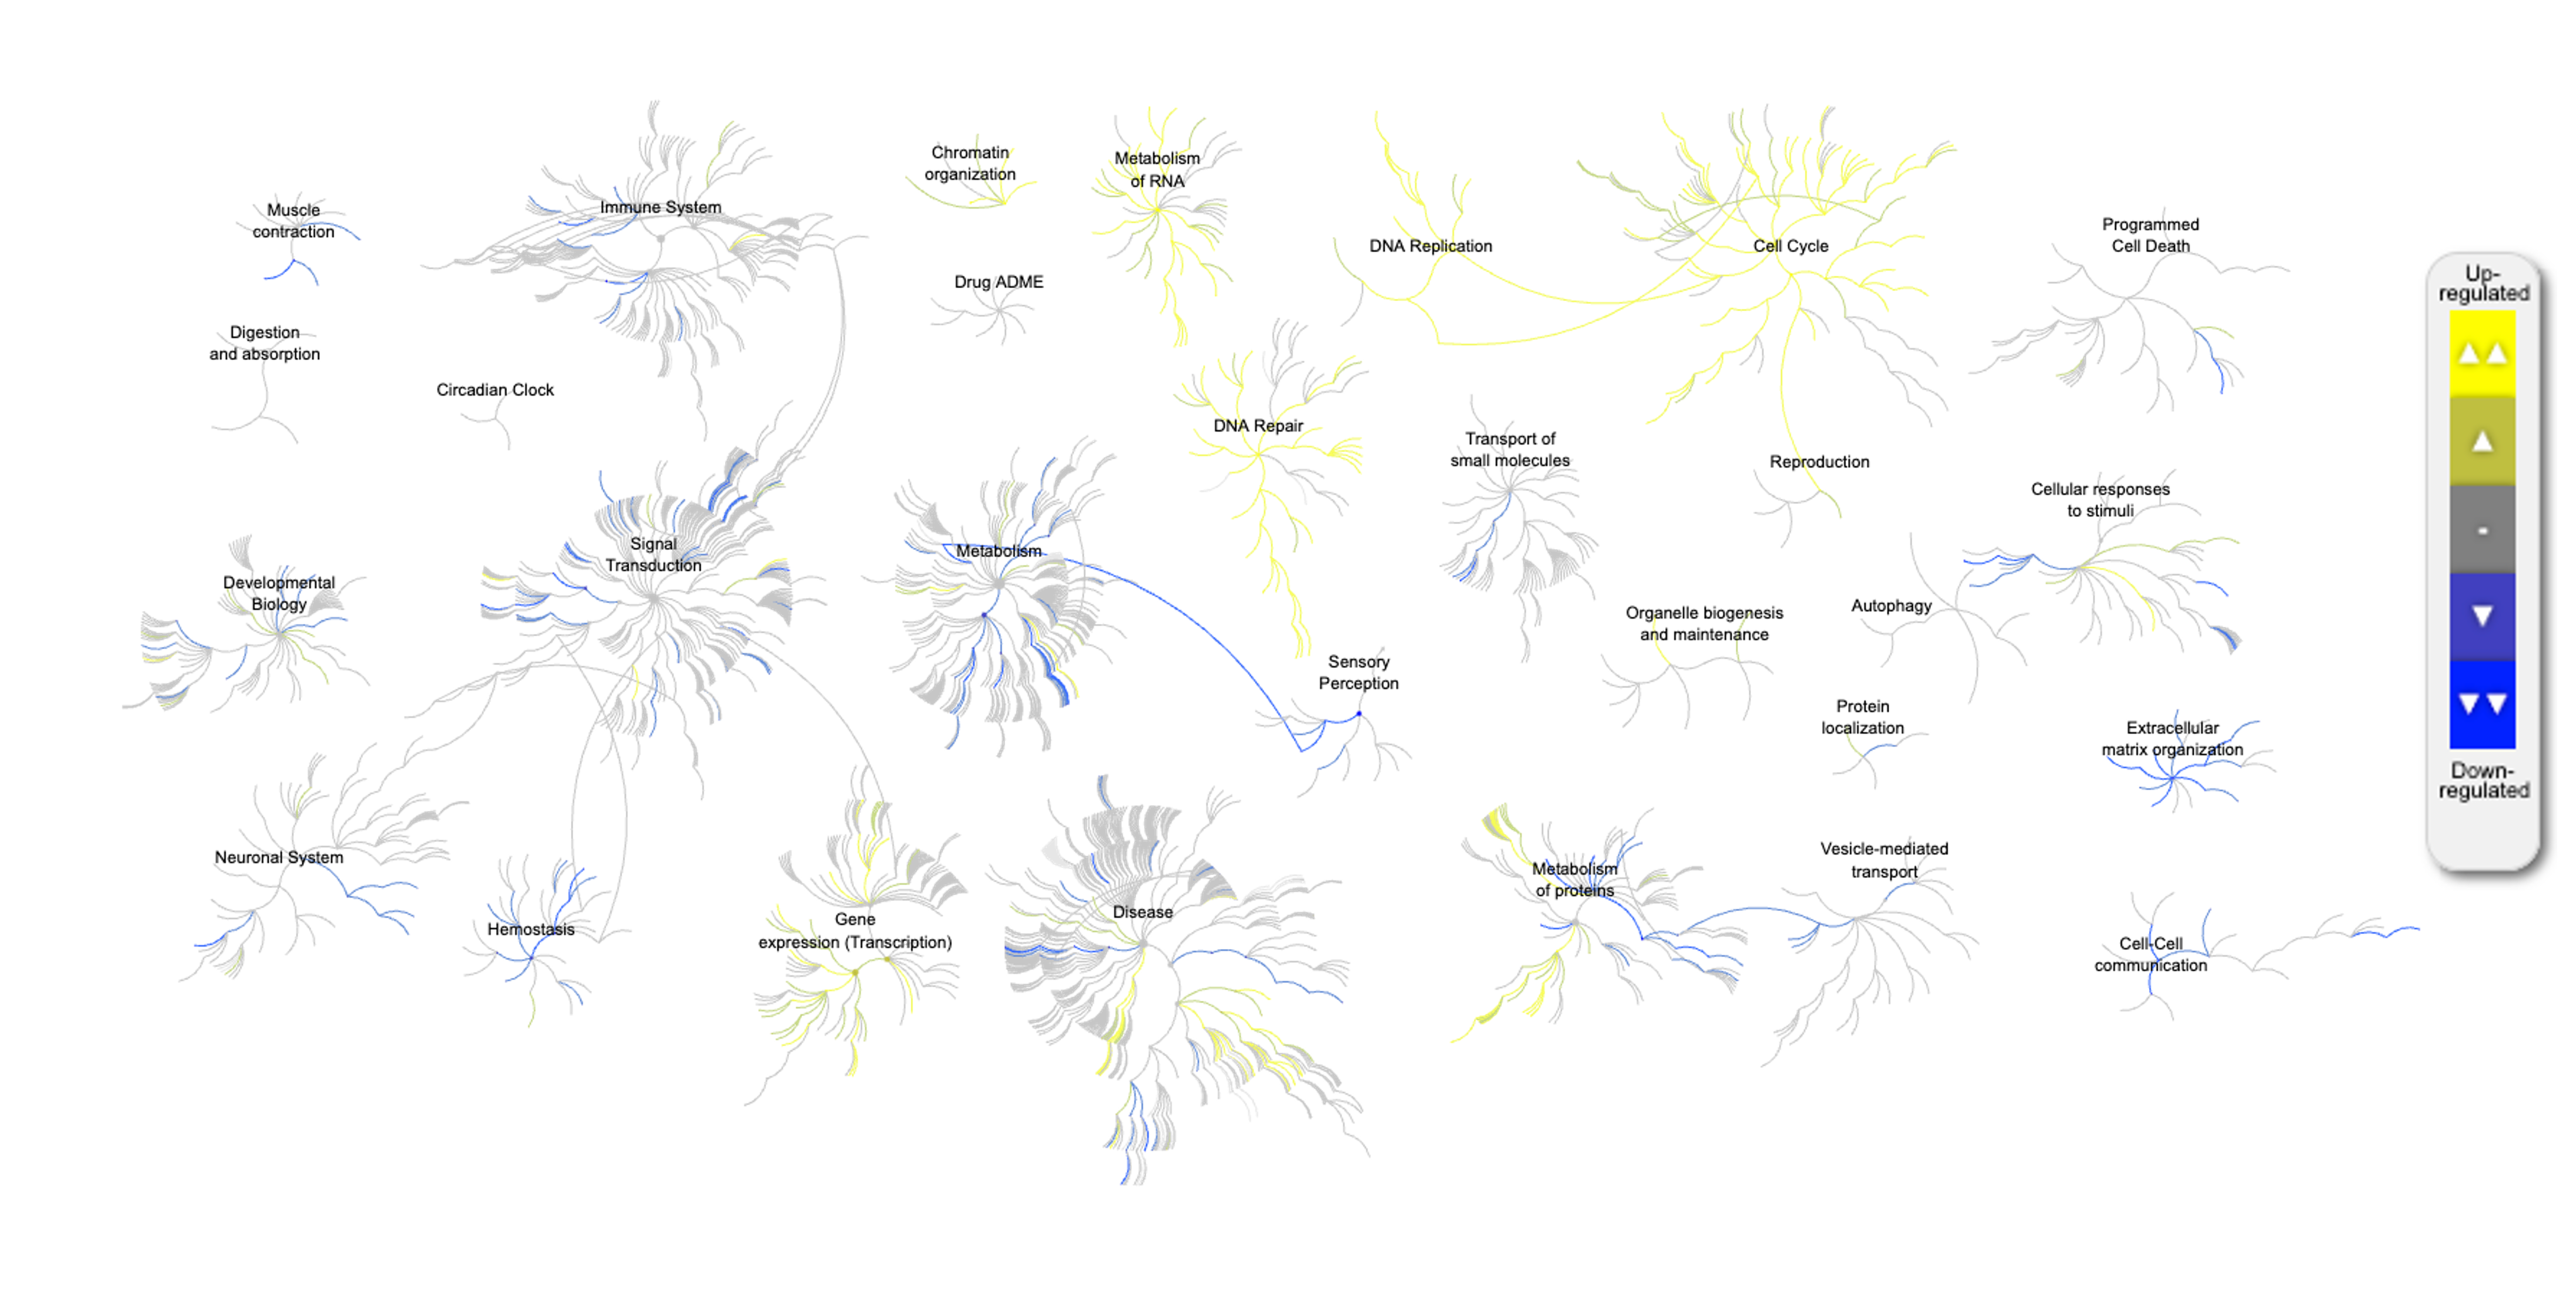
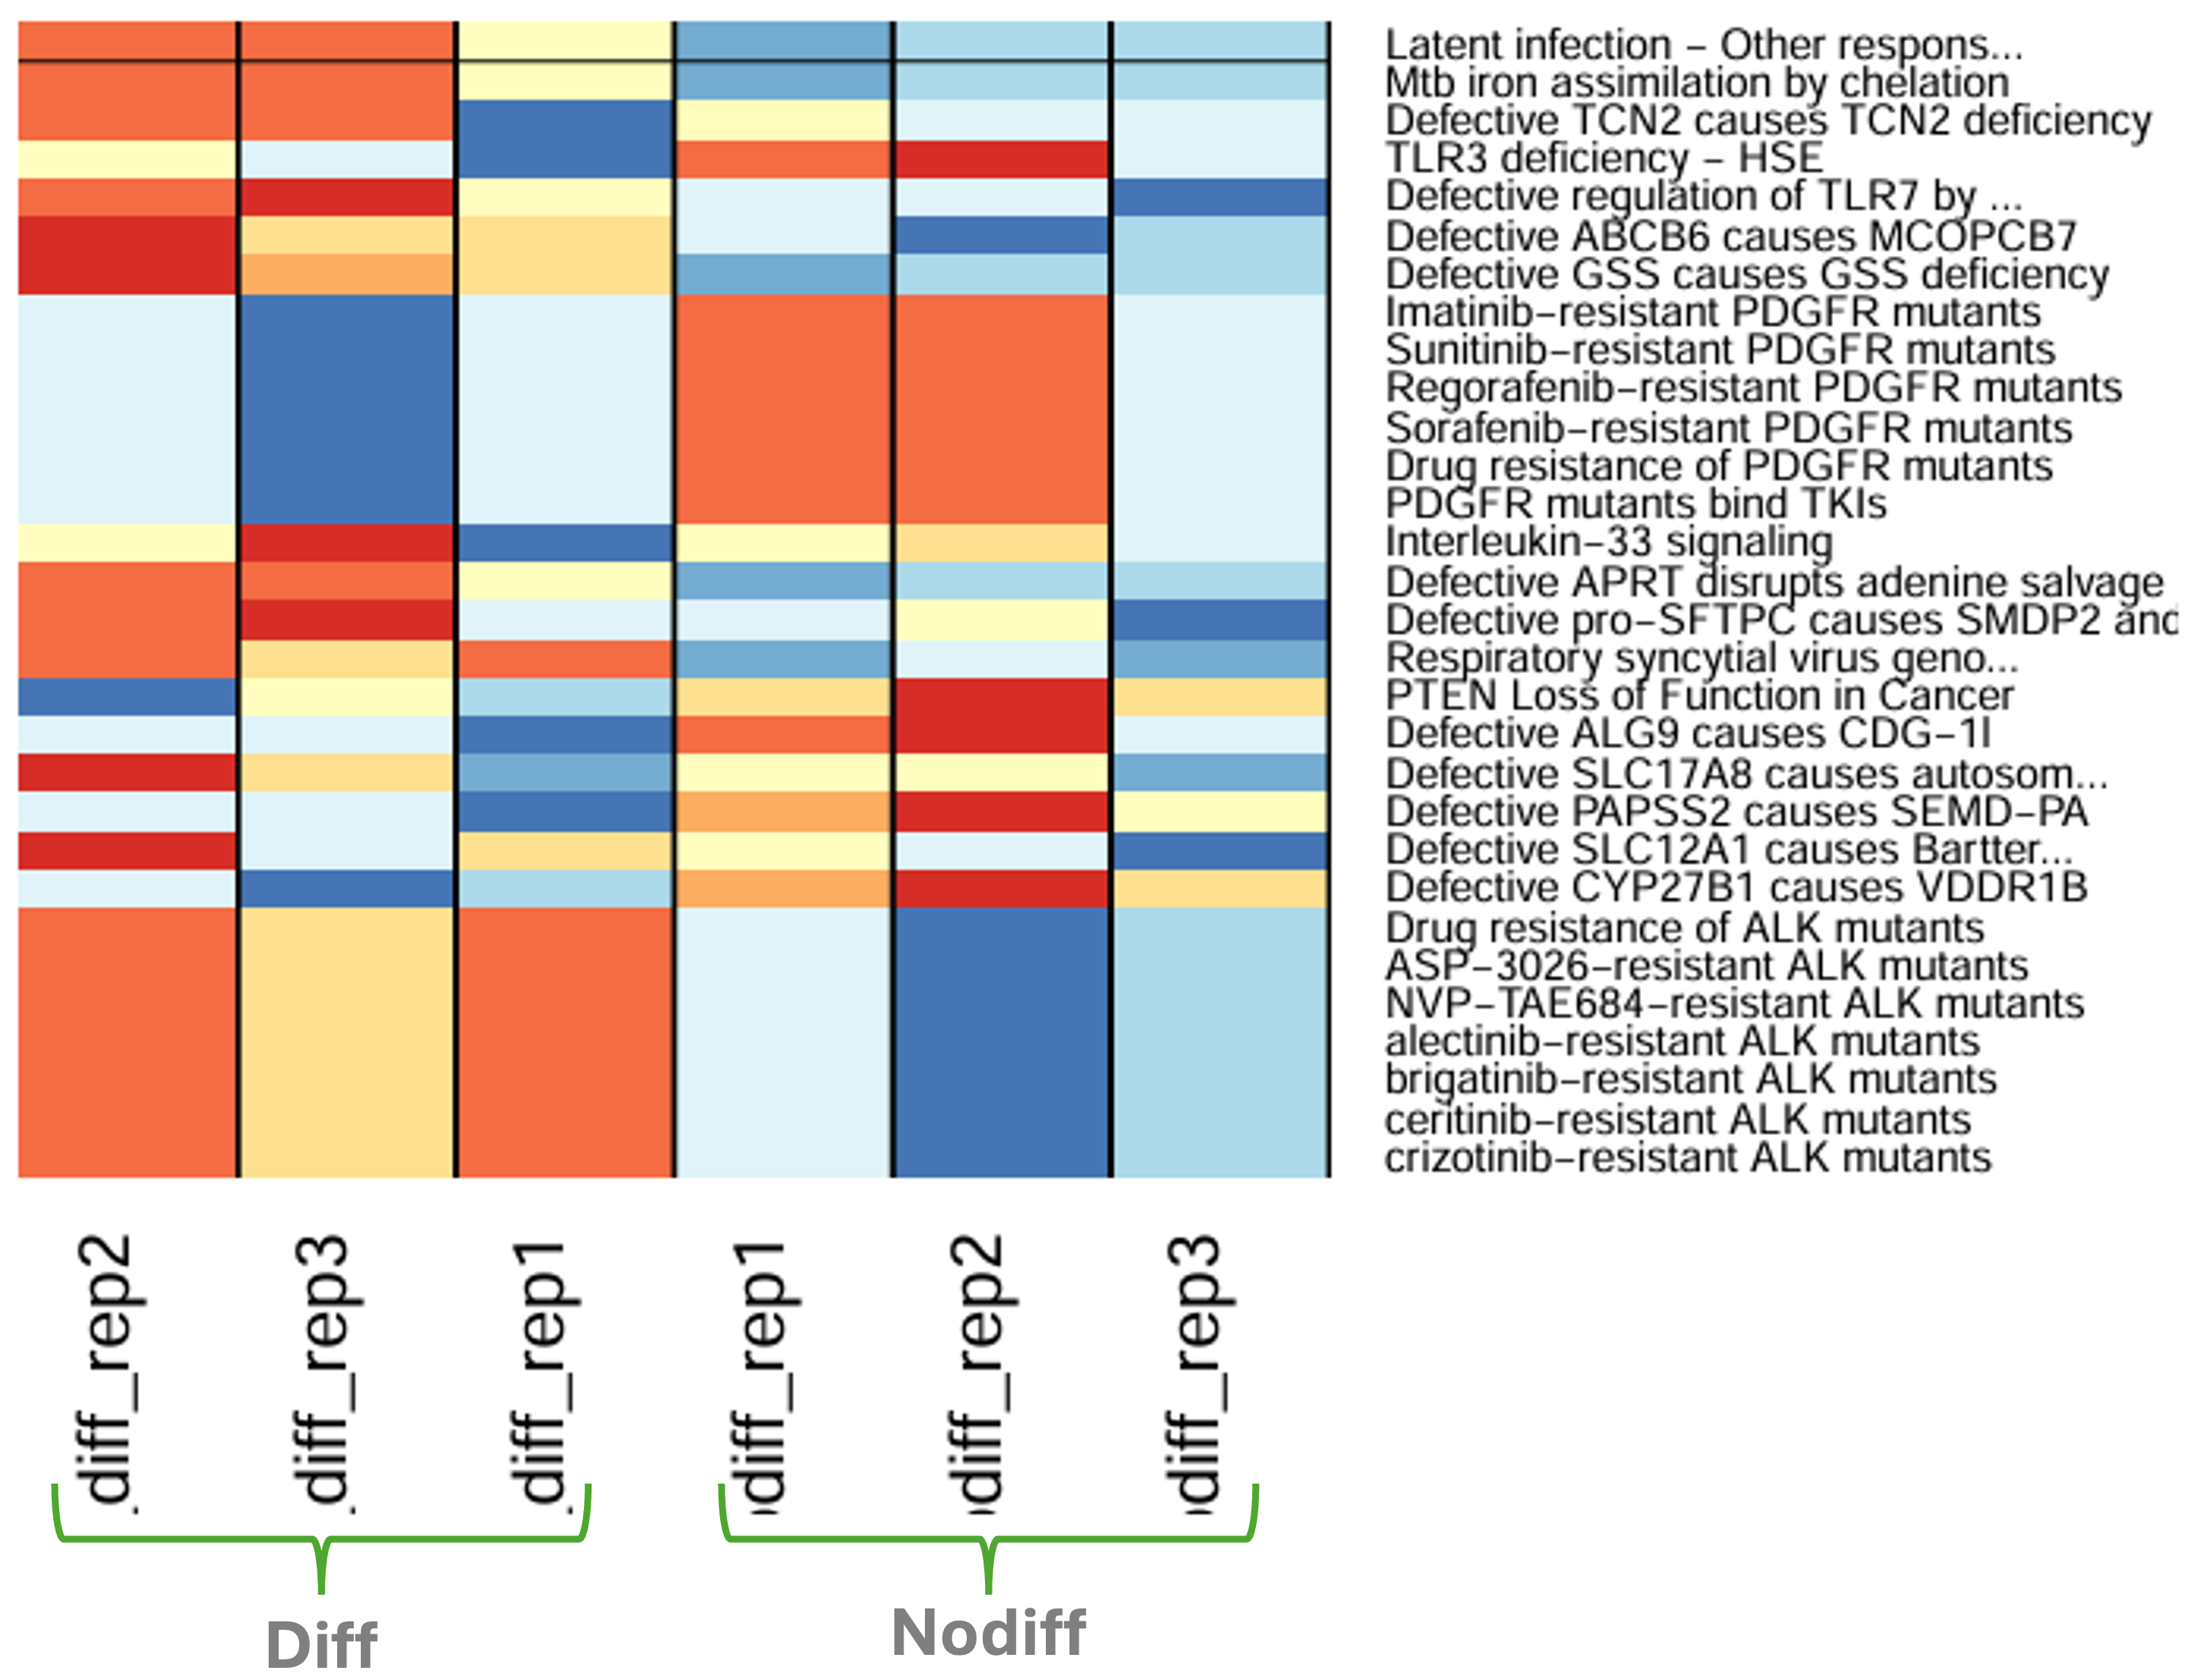
In case ssGSEA was selected, an overall output would look like below: