4 Experimental Design
RNA-Seq is a powerful tool for capturing high-throughput gene expression. It captures the expression of thousands of genes in different samples across multiple conditions. A general approach to analysing RNA-seq data is to fit a linear model to each gene. The gene expression measurement for each gene has a mix of biological signal and unwanted noise. The methodology must be carefully thought of to design a well-balanced experiment for a robust statistical analysis. After you have made decisions on the type of sequencing (long-read or short-read) and the type of RNA-Seq (full-length/targeted/bulk/single-cell), the next step is to consider other factors that can influence your experiment.
Select an appropriate source of samples: cell lines, animal models, patients, etc.
Sequencing depth - the total number of reads mapped to the reference genome. How much sequencing depth is required for the experiment?
Balancing the variation in the experiment: Understand technical and biological replicates and determine the number replicates needed for the experiment?
Batch effects can add unwanted variation in the experiment.
Confounding factors: Sex, age, litter etc.
4.1 Source of samples
The primary goal of RNA-seq analysis is to identify differentially expressed genes between distinct groups or conditions. The source of samples can vary widely, ranging from cells cultured in vitro, whole tissues, sorted cells, homogeneous cell lines, or cells derived from a tissue or organ, either from a single patient or multiple patients. The choice of sample source introduces both wanted and unwanted variations in the data, which must be carefully addressed to ensure accurate analysis.
For example, when assessing the effect of a treatment on cells from three different human liver cell lines, the biological differences between the cell lines may overshadow the treatment effect, leading to confounded results. Therefore, before performing differential expression analysis, it is crucial to account for and remove unwanted variations, such as those arising from the cell lines, to focus on the true biological differences caused by the treatment.
4.2 Sample Replicates (technical/biological)
A well-designed RNA-Seq experiment should always include replicates. Replicates are crucial as they enhance the statistical power of the analysis, allowing for more accurate and reliable detection of true biological differences. Consistent results across multiple replicates provide confidence that the observed findings are genuine and not due to random chance. Therefore, incorporating replicates in your experiment is essential to ensure the robustness and reproducibility of the results, ultimately leading to more credible and meaningful biological insights.
- Biological replicates - “Correct way” of including replicates in your study - These are independent samples that are taken from different individuals, organisms, or cells under the same experimental conditions to capture the biological variation between samples. The biologically separate samples can include different individuals in a population (e.g., 10 healthy individuals and 10 individuals with a disease), different cell cultures of the same cell line, tissue samples from different animals (e.g., liver tissue of multiple knockout mice and wild-type mice), tumor biopsies of multiple patients in each group (each patient serves as a biological replicate), etc.
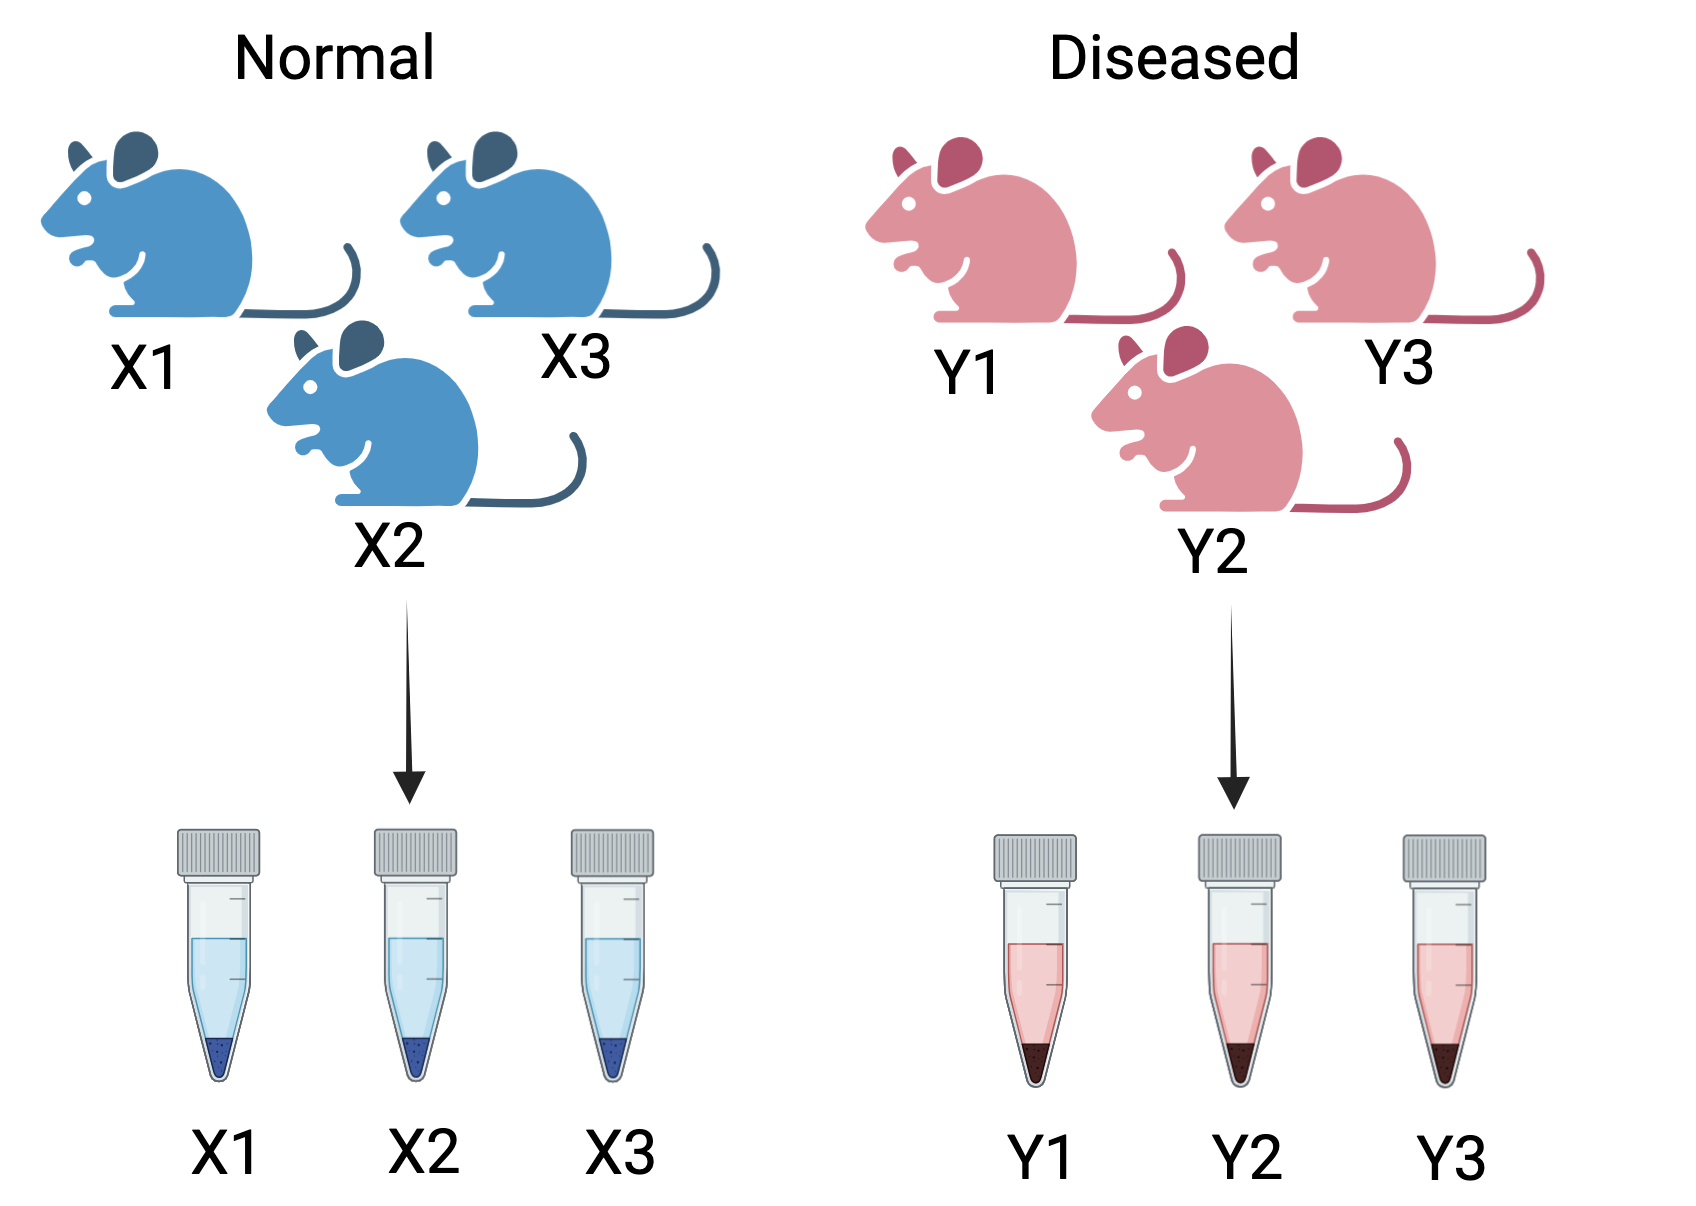
Figure 4.1: Correct way to create biological replicates: A measurement taken from the three different mice for two conditions - normal and diseased. These are called biological replicates. These capture the biological variation between samples
Consider a simple RNA-Seq experiment comparing two conditions: normal and diseased. The samples are collected from three different mice for each healthy and diseased state. We obtain the following sample sheet:
| sample | condition | replicates |
|---|---|---|
| mouseX1_normal | normal | X1 |
| mouseX2_normal | normal | X2 |
| mouseX3_normal | normal | X3 |
| mouseY1_diseased | diseased | Y1 |
| mouseY2_diseased | diseased | Y2 |
| mouseY3_diseased | diseased | Y3 |
In this experiment, X1, X2, and X3 represent the biological replicates for the normal condition, while Y1, Y2, and Y3 represent the biological replicates for the diseased condition. Including multiple animals accounts for natural biological variability, enhancing the robustness of statistical analysis. This approach ensures that the results are reliable, generalizable, and not driven by outliers or random chance.
- Technical replicates - “Incorrect way” of including replicates in your study - These are repeated measurements taken from the same biological sample to accurately assess technical variation in an experiment. These replicates are used to control for errors in the experimental process, such as library preparation, sequencing, and sample handling. Examples of technical replicates are: constructing multiple RNA Libraries from the same sample, sequencing the same RNA library multiple times on different sequencing lanes or platforms, etc.
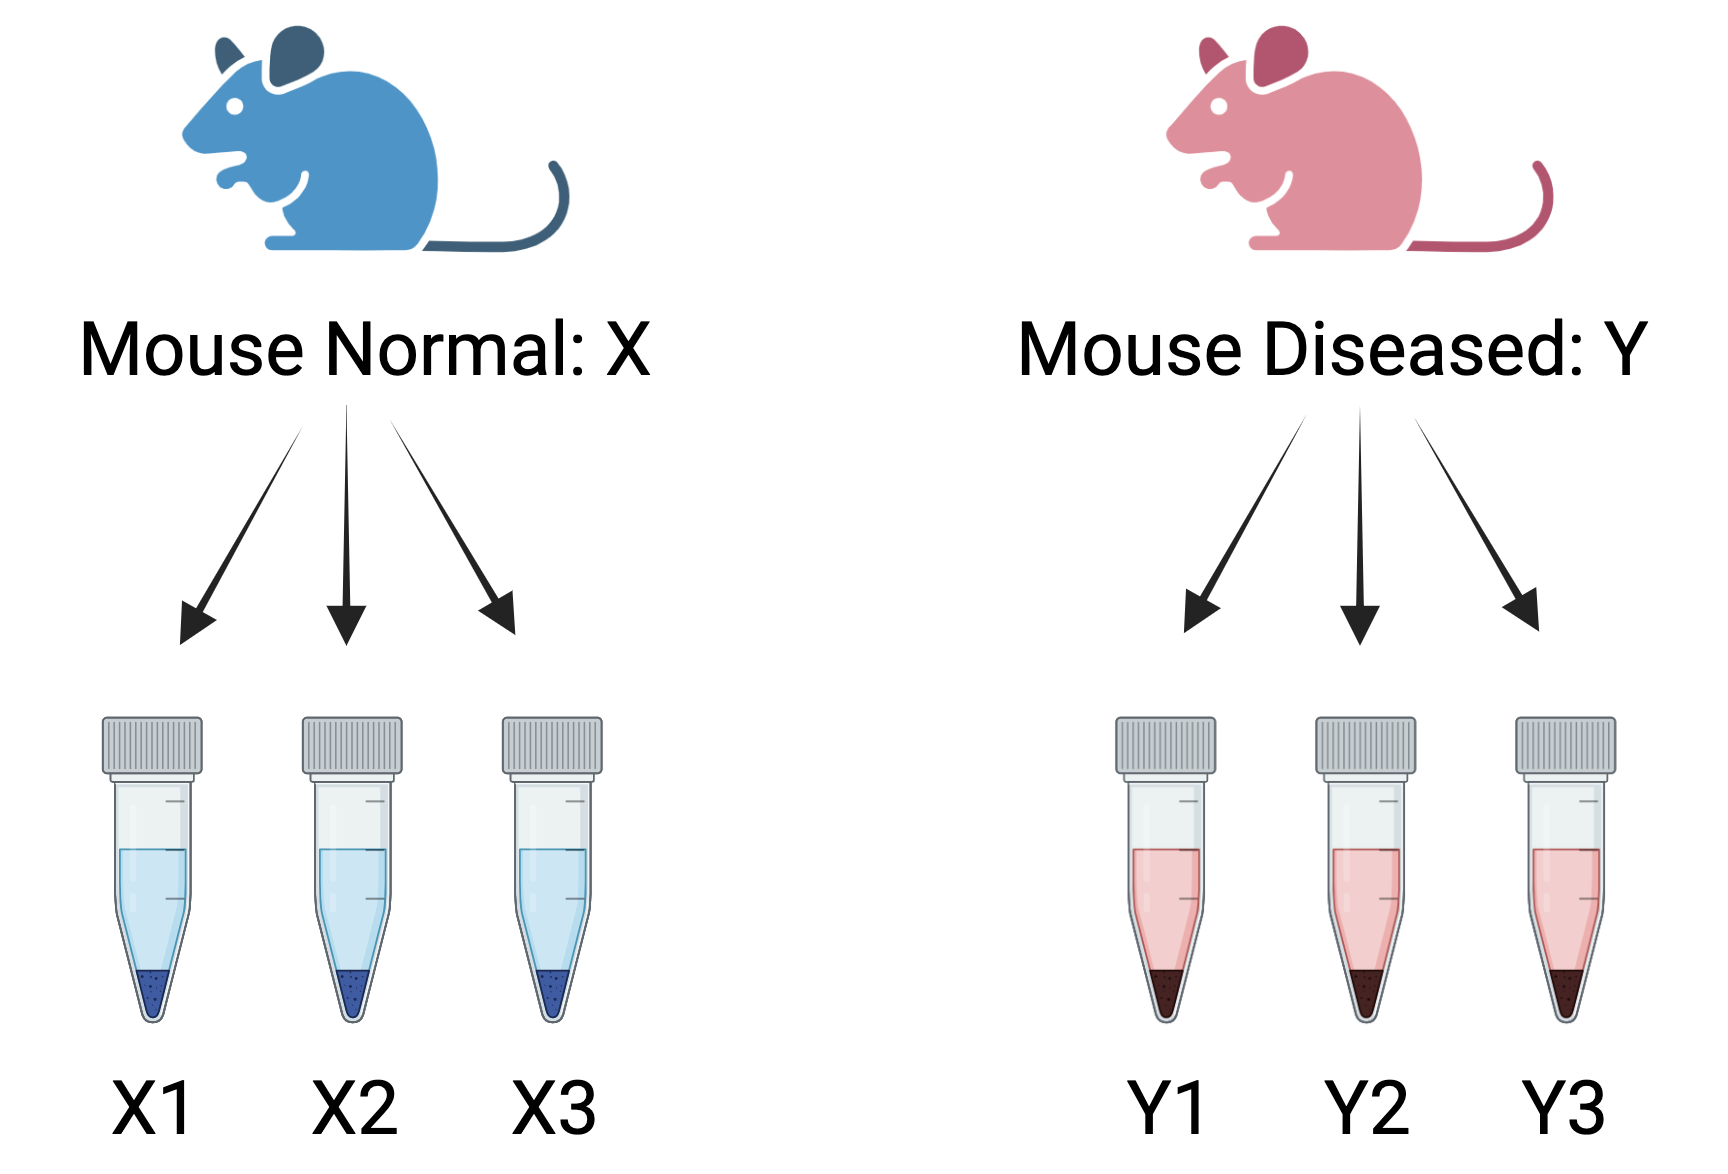
Figure 4.2: Wrong way to create biological replicates: Three measurements taken from the same mouse for two conditions- normal and diseased. These are called technical replicates. These assess technical variation in an experiment.
Consider the above RNA-Seq experiment comparing two conditions: normal and diseased. If only a single normal mouse is used to generate three measurements (mouseX_normal_1, mouseX_normal_2, mouseX_normal_3) and similarly, a single diseased mouse generates three measurements (mouseY_diseased_1, mouseY_diseased_2, mouseY_diseased_3), these measurements would be considered technical replicates rather than biological replicates.This results in the following samplesheet:
| sample | condition | mouse | technical replicates |
|---|---|---|---|
| mouseX_normal_1 | normal | X | 1 |
| mouseX_normal_2 | normal | X | 2 |
| mouseX_normal_3 | normal | X | 3 |
| mouseY_diseased_1 | diseased | Y | 1 |
| mouseY_diseased_2 | diseased | Y | 2 |
| mouseY_diseased_3 | diseased | Y | 3 |
Technical replicates help assess the consistency of the sequencing process and reduce technical noise. However, they do not account for biological variability, which is crucial for ensuring the generalizability of the results. Without biological replicates, the experiment lacks the ability to capture natural biological variation, and any differential expression detected may be specific to those individual mice rather than representative of broader trends across the population. Increasing the number of biological replicates enhances the accuracy of biological variation estimates and the precision of mean expression level estimates. This, in turn, leads to better data modeling and the identification of more differentially expressed genes. The emphasis, therefore, is on maximizing biological replicates to capture the true variability in biological systems.
 Sample pooling
Sample pooling in RNA-Seq is used by experimental biologists to reduce sequencing costs, particularly when RNA input is low. While pooling offers practical benefits, it also introduces pitfalls that can negatively affect data quality and the conclusions drawn from the experiment. Some of the key challenges include (Rajkumar, A.P. et al, Experimental validation of methods for differential gene expression analysis and sample pooling in RNA-seq. 2015):
If not done carefully, pooling can lead to several issues:
Samples with varying RNA quality, quantities, or levels of degradation may contribute unevenly to the pool, complicating normalization and affecting downstream analysis.
Unequal amounts of RNA pooled from each sample can result in disproportionate representation, potentially skewing the data.
An outlier among pooled samples can skew the average expression values and introduce bias.
If different pools of samples are processed, prepared, or sequenced in separate batches, this can lead to batch effects. It is impossible to correct for batch effect if the barcodes are absent or corrupted or poorly designed.
Pooling collapses multiple biological samples into one losing the ability to estimate biological variability.
Pooling averages out differences between samples, which can mask important biological signals. It can lead to loss of biologically meaningful heterogeneity.
Pooling decreases the statistical power and ability to estimate within population variation.
We strongly advise discussing your pooling strategy with a bioinformatician before proceeding, as these challenges can significantly impact the success of your experiment and its analysis.
4.3 Batches and their effects
In an RNA-Seq experiment, samples are often processed in batches or groups, and batch effects can arise from various sources throughout the experimental workflow. These effects may stem from differences in sequencing platforms, timing, reagents, experimental conditions, or even variations in how different researchers handle the samples. Batch effects pose a significant challenge in RNA-Seq data analysis, as they can obscure true biological differences and lead to misleading interpretations.
For example, when visualizing RNA-seq data using a multidimensional scaling (MDS) plot, batch effects can cause unexpected grouping of samples. Imagine an experiment designed to assess the effects of gene 1 and gene 2 knockouts compared to a control. Samples are collected from three patients, X, Y, and Z. Ideally, the samples should form distinct clusters based on the experimental conditions (knockout versus control). However, in the first panel of the MDS plot, the samples instead cluster into three groups, corresponding to the patients they were derived from, not the experimental conditions.
This scenario illustrates a typical batch effect, where the biological differences between the patients overshadow the intended experimental treatment differences. Such a confounding effect complicates the interpretation of the results. After correcting for patient-specific variability (i.e., removing the batch effect), the samples re-cluster according to the experimental conditions, allowing for accurate comparisons between the knockout and control groups. This adjustment helps to ensure that the observed differences reflect the treatment effects rather than unintended batch influences.
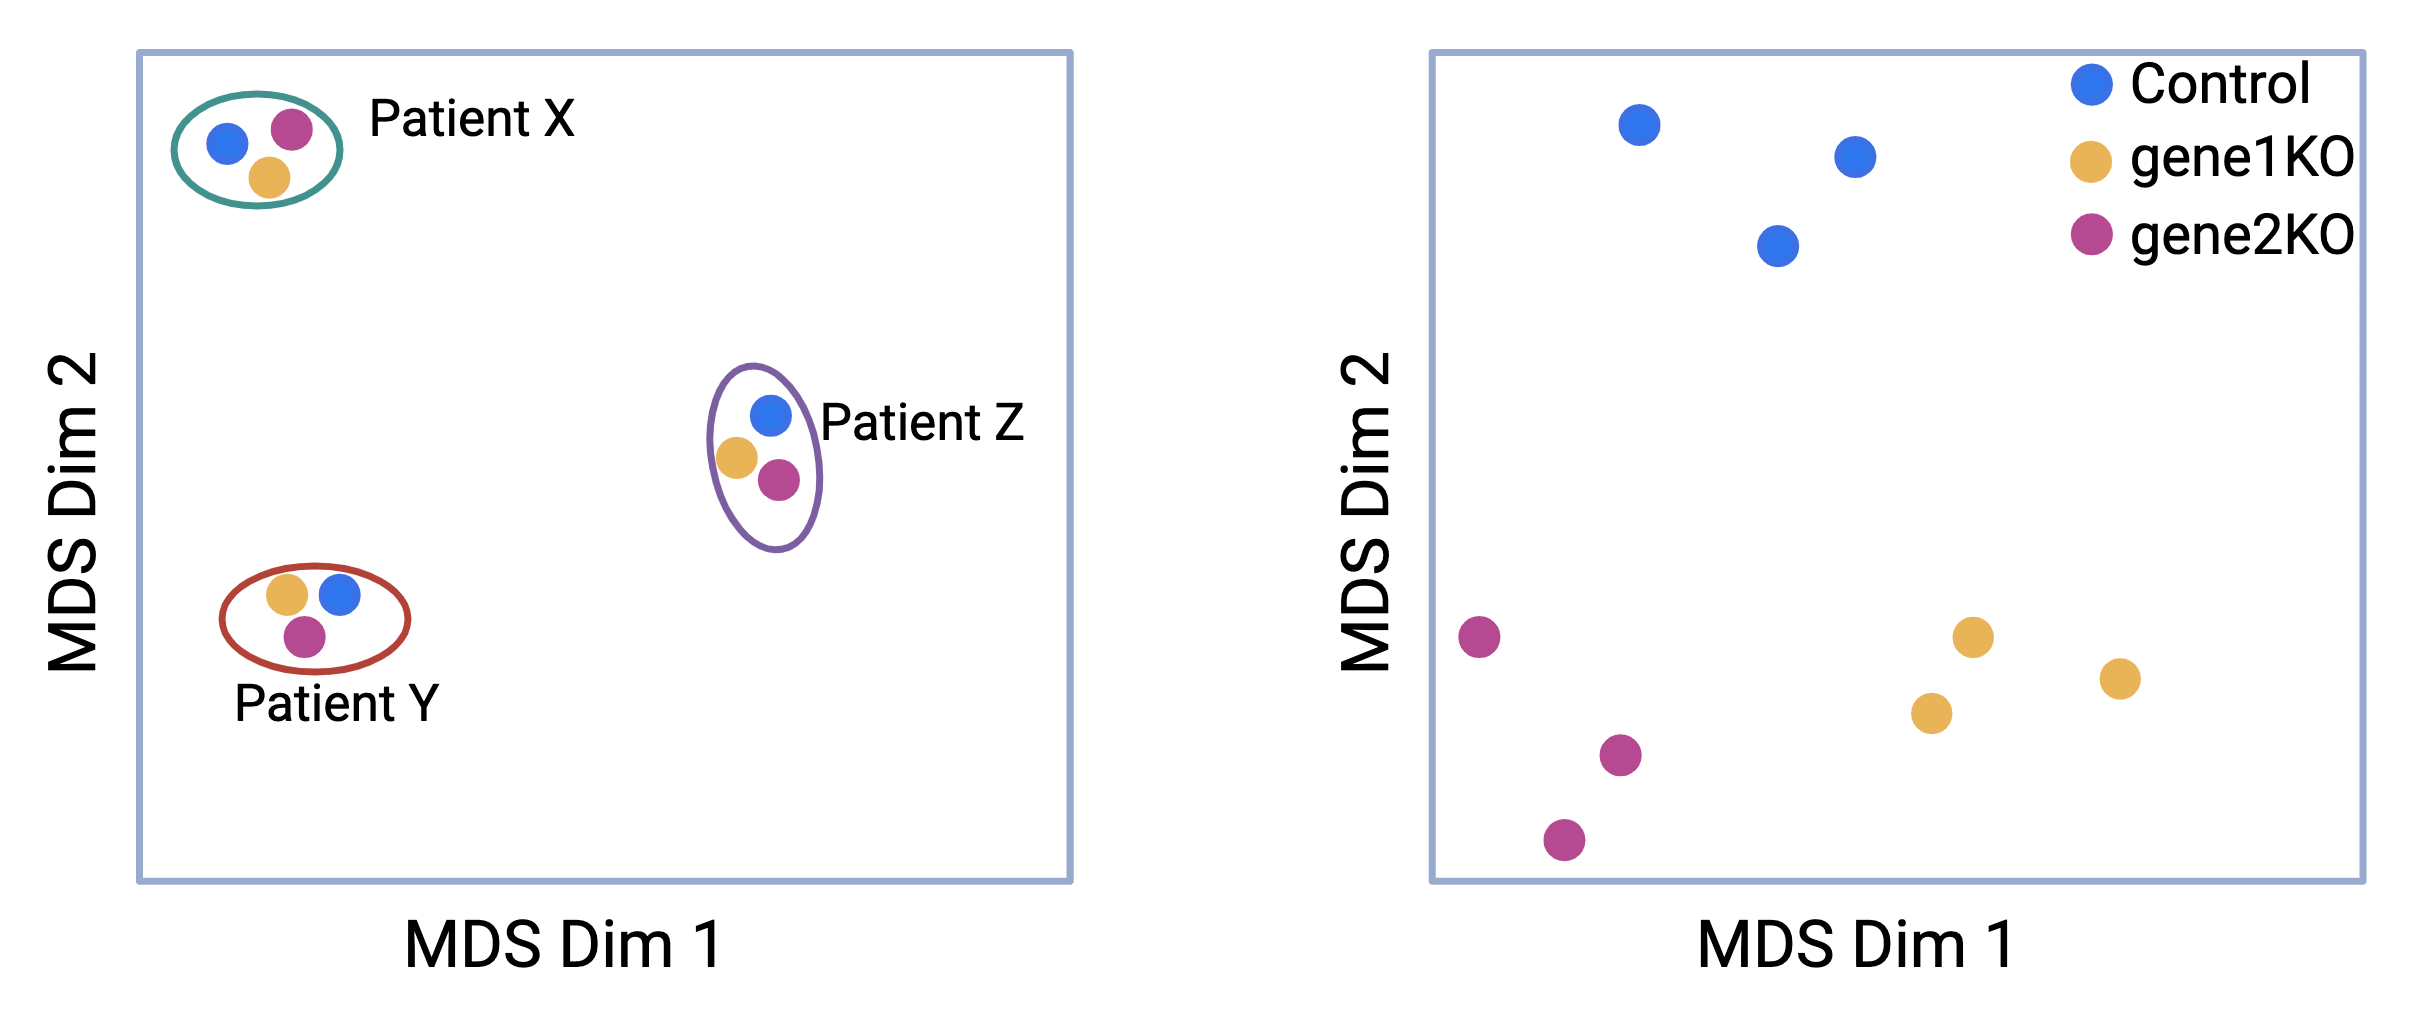
Figure 4.3: Batch effects: MDS plot before and after removing patient variation from the data.
Here are a few examples of batch effects:
- On the day of the experiment:
- Disease group on day 1, healthy group on day 2
- Morning vs afternoon collection (metabolic studies) & season (microbiome)
- Snap freezing vs just freezing
- Protocol changes/optimisation
- Cage position in animal facility
- During library preparation:
- Half of libraries prepared by one operator, other half by other operator.
- Samples are processed/extracted in order of patient/mice/timepoint (not randomised)
- Old/expired kit to start with, new kit to finish
- Sequencing:
- Different operators organising sequencing runs
- Multiple sequencing runs spaced across months/years
- Facility library prep kit changes instrumentation upgrades over time
Thus, it is crucial to think about what might contribute to a batch effect at the start of your project, keep good records and/or ensure you can access additional information in the future if required, thoroughly investigate the data, collect detailed information about the experimental design, and account for batch effects during differential expression analysis. Proper adjustment ensures more accurate and reliable biological interpretations, enabling meaningful insights from the RNA-Seq data.
4.4 Confounding factors
A confounded RNA-Seq experiment is one in which the distinct effects of two different sources of variation in the data cannot be separated.
For instance, sex is known to significantly influence gene expression. If all the control mice in an experiment were female and all the treatment mice were male, the treatment effect would be confounded by sex. In this scenario, it would be impossible to distinguish the treatment effect from the effect of sex. Consider another scenario, if all the control mice are from cage A and all the treatment mice for cage B, the treatment effects are confounded by the cage. The living conditions in the two cages may vary which is indistinguishable from the treatment effects.
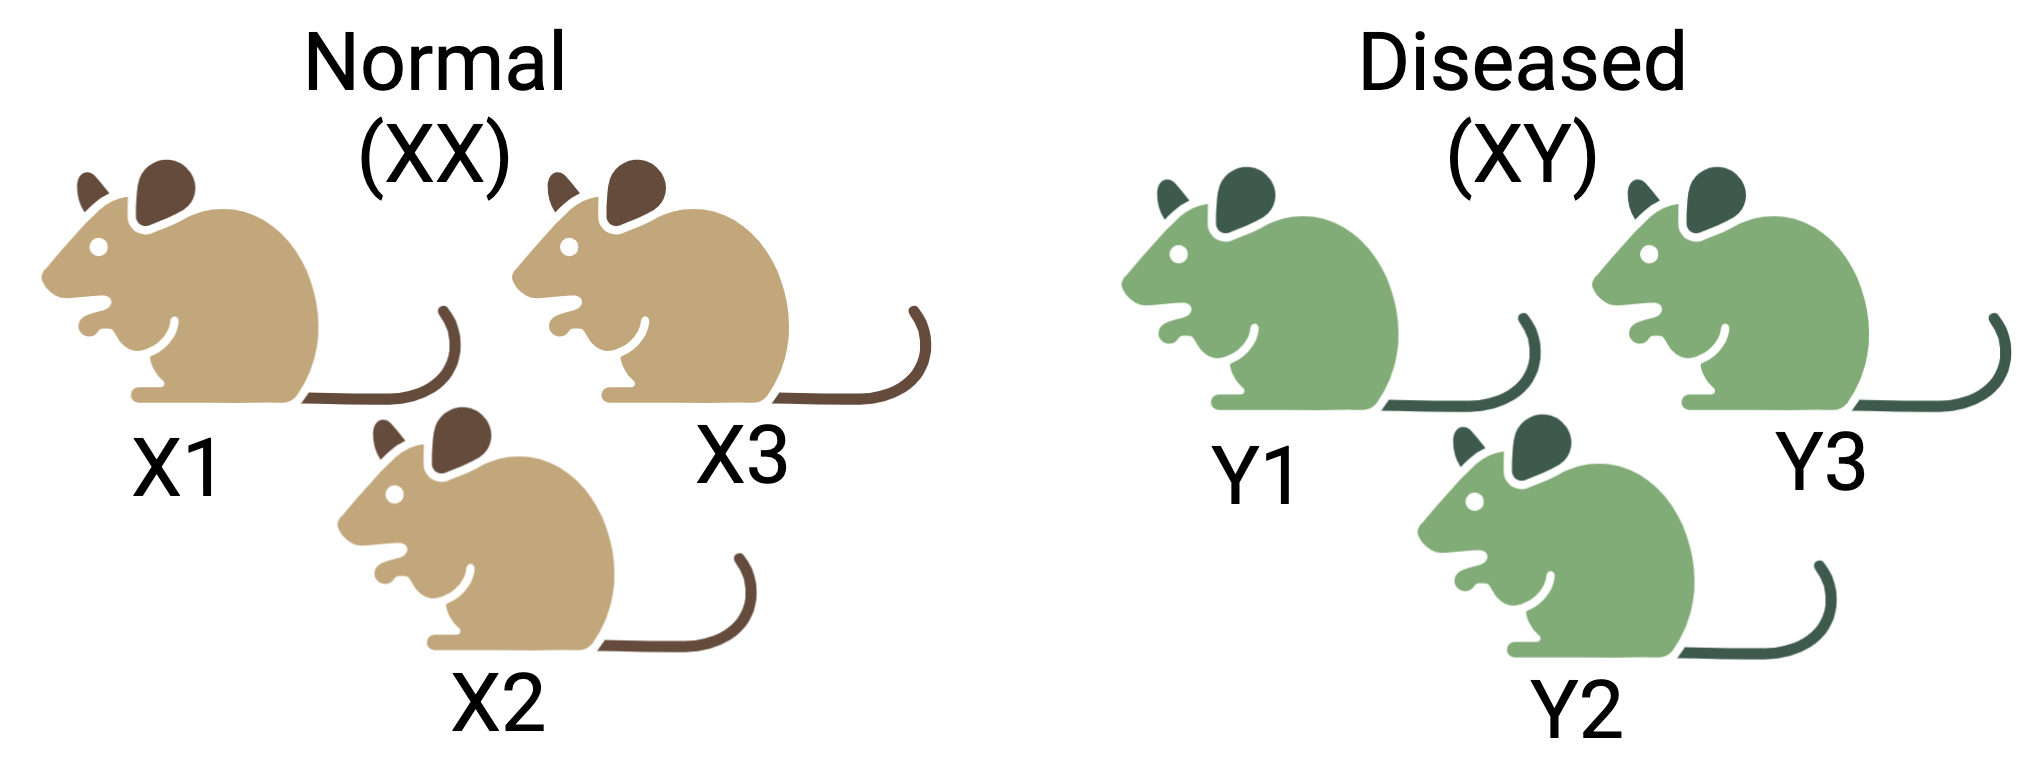
Figure 4.4: Confounding effects in RNASeq experiments: Three mice are selected each for the two conditions- normal and diseased. But the normal group consist of only female (XX) mice and vice versa. It will be difficult to determine if the true difference between two groups is due to the condition or the sex.
However, it is not always possible to mix the mice due to the design of the experiment. When comparing diseased vs. healthy mice that are kept in different cages by design, you risk confounding the biological condition (disease vs. healthy) with cage-specific effects, such as environmental differences (e.g., diet, microflora, stress levels) that can affect gene expression independently of the disease. To mitigate this potential confounding factor, you can take several measures to ensure that cage effects do not bias the results.
Use Multiple Cages per Group (Biological Replicates) and account for Cage as a Random Effect: Make sure to keep both the diseased and healthy groups housed in multiple cages, with several biological replicates (mice) per condition distributed across different cages. For example, keep 2-3 diseased mice per cage across 3-4 cages and do the same for healthy mice. This helps distribute cage-specific environmental factors.
This way, the variation between cages can be treated as a random effect in the statistical analysis. By doing this, we can separate out any variance caused by cage differences from the variance caused by the condition itself, allowing for more accurate comparisons of gene expression between conditions. This can be done by using mixed-effects models (e.g., linear mixed models) where tthe cage is treated as a random effect and the condition (disease vs. healthy) is a fixed effect. This helps isolate the influence of disease vs. healthy status from any systematic cage-related bias. But this is beyond the scope of this workshop.
Rotate or Randomly Assign Mice to Cages: If feasible,randomise the assignment of mice, i.e., randomly assign mice to cages or rotate them between cages during the experiment to avoid any systematic differences between cages that could lead to confounding.
In case of a big experiment with multiple cages, measuring and monitoring environmental factors in each cage, such as temperature, humidity, air quality, food consumption, and microbial flora will help assess whether any specific environmental variables correlate with gene expression differences. If necessary, these environmental factors can be included as covariates in the statistical analysis.
4.5 Summary
In conclusion, designing a robust RNA-Seq experiment requires thoughtful consideration of various factors to ensure accurate and meaningful results. From selecting the appropriate sample sources to determining the necessary sequencing depth (typically 10 to 20 million reads per sample for a standard gene expression analysis), every decision influences the quality of the data and the validity of the conclusions drawn. The inclusion of biological replicates is essential for capturing natural variability, while technical replicates help control for experimental errors. As a general rule for a standard RNA-Seq experiment, at least three biological replicates should be included, though it is ideal to have more to increase statistical power.
Attention must also be paid to potential sources of unwanted variation, such as batch effects and confounding factors, which can obscure true biological signals. These challenges can be mitigated through careful planning, including randomization, and advanced statistical modeling. Addressing these variables not only enhances the reliability of the experiment but also enables a more accurate interpretation of gene expression differences, leading to more valid biological insights. We’ll discuss more about the experimental and statistical strategies in the next sections. Ultimately, a well-balanced experimental design is crucial for the success of RNA-Seq studies and for generating reproducible and insightful data.
).](images/experimental_design/exp-factors.png)
Figure 4.5: Summary: Factors affecting the outcome of an RNA-Seq experiment (source).
Challenge - Design a RNA Seq experiment.
Investigate the expression profiles of basal stem cells (B) and luminal cells (L) in the mammary glands of virgin, pregnant, and lactating mice. All samples have been mapped to the GRCm39 genome assembly.
1. Each sample is labeled with the following format: Mm[MouseID]_cg[CageID]_[Condition]_[CellType][ReplicateNumber]. The samples are as follows:
  * Mm1_cgX_vir_B1
  * Mm2_cgX_vir_B2
  * Mm3_cgY_vir_B3
  * Mm1_cgX_vir_L1
  * Mm2_cgX_vir_L2
  * Mm3_cgY_vir_L3
  * Mm4_cgX_preg_B1
  * Mm5_cgX_preg_B2
  * Mm6_cgY_preg_B3
  * Mm4_cgX_preg_L1
  * Mm5_cgX_preg_L2
  * Mm6_cgY_preg_L3
  * Mm7_cgX_lact_B1
  * Mm8_cgX_lact_B2
  * Mm9_cgY_lact_B3
  * Mm7_cgX_lact_L1
  * Mm8_cgX_lact_L2
  * Mm9_cgY_lact_L3
Answer the following questions:
How many experimental groups are defined by the design?
How many biological replicates a) per group; b) across all groups; are there in this experiment?
How many technical replicates are there in this experiment?
Create a sample sheet for the experimental design including all relevant factors that might affect the outcome.
-
Mice were housed in two separate cages:
cgXandcgY. Discuss the following:Could cage assignment introduce a confounding variable?
How would you visualize the data to check for batch effects?