6 Cell type annotation with singleR
Load up the MMR atlas as a singleR reference Reference dataset is from this paper: https://doi.org/10.1016/j.cell.2021.08.003 Read in the fetal gut atlas as well https://www.gutcellatlas.org/
This code is not run for this guide and only the final annotations are provided
# Load up the MMR atlas as a singleR reference
# Reference dataset is from this paper: https://doi.org/10.1016/j.cell.2021.08.003


mmr_atlas <- qread("./data/Xenium/public_references/GSE178341_lognorm_annotated.qs")
# Read in the fetal gut atlas as well https://www.gutcellatlas.org/
gut_atlas <- qread("./data/Xenium/public_references/Reference/Gut_Atlas_Seurat.qs")


# Make some smaller pseudobulk objects to load more quickly
avg_expr_MMR <- AggregateExpression (mmr_atlas, group.by = c("cl295v11SubFull"), return.seurat=TRUE)
normed_counts <- avg_expr_MMR@assays$RNA$counts
normed_counts[1:5,1:5]
qsave(normed_counts, "./data/Xenium/preprocessed/Reference/MMR_atlas_lowlevel_cell_counts.qs")


# Make some smaller pseudobulk objects to load more quickly
avg_expr_MMR_mid <- AggregateExpression (mmr_atlas, group.by = c("clMidwayPr"), return.seurat=TRUE)
normed_counts <- avg_expr_MMR_mid@assays$RNA$counts
normed_counts[1:5,1:5]
qsave(normed_counts, "./data/Xenium/preprocessed/Reference/MMR_atlas_midlevel_cell_counts.qs")


# Key gut atlas annotations
table(gut_atlas$Integrated_05)
table(gut_atlas$category)
table(gut_atlas$Age_group)

# Keep only the adult tissues
# mesenteric lymph nodes (MLNs)
gut_atlas_adult <- gut_atlas[,gut_atlas$Age_group %in% c("Adult", "Adult_MLN")]

# Make some smaller pseudobulk objects to load more quickly
avg_expr_gut <- AggregateExpression (gut_atlas_adult, group.by = c("Integrated_05"), return.seurat=TRUE)
normed_counts <- avg_expr_gut@assays$RNA$counts
normed_counts[1:5,1:5]
qsave(normed_counts, "./data/Xenium/preprocessed/Reference/Gut_cell_atlas_lowlevel_cell_counts.qs")


# Make some smaller pseudobulk objects to load more quickly
avg_expr_gut_mid <- AggregateExpression (gut_atlas_adult, group.by = c("category"), return.seurat=TRUE)
normed_counts <- avg_expr_gut_mid@assays$RNA$counts
normed_counts[1:5,1:5]

qsave(normed_counts, "./data/Xenium/preprocessed/Reference/Gut_cell_atlas_midlevel_cell_counts.qs")
Load the pseudobulked cell type references
avg_expr_MMR <- qread("./data/Xenium/preprocessed/Reference/MMR_atlas_lowlevel_cell_counts.qs")
avg_expr_MMR_mid <- qread("./data/Xenium/preprocessed/Reference/MMR_atlas_midlevel_cell_counts.qs")
avg_expr_gut <- qread("./data/Xenium/preprocessed/Reference/Gut_cell_atlas_lowlevel_cell_counts.qs")
avg_expr_gut_mid <- qread("./data/Xenium/preprocessed/Reference/Gut_cell_atlas_midlevel_cell_counts.qs")
Add on the annotations for the MMR atlas and gut cell atlas
# Add on the annotations for the MMR atlas
predictions <- SingleR(test=cropped.obj@assays$Xenium$counts,
ref=avg_expr_MMR, labels=colnames(avg_expr_MMR),
aggr.ref = F, num.threads = 10)
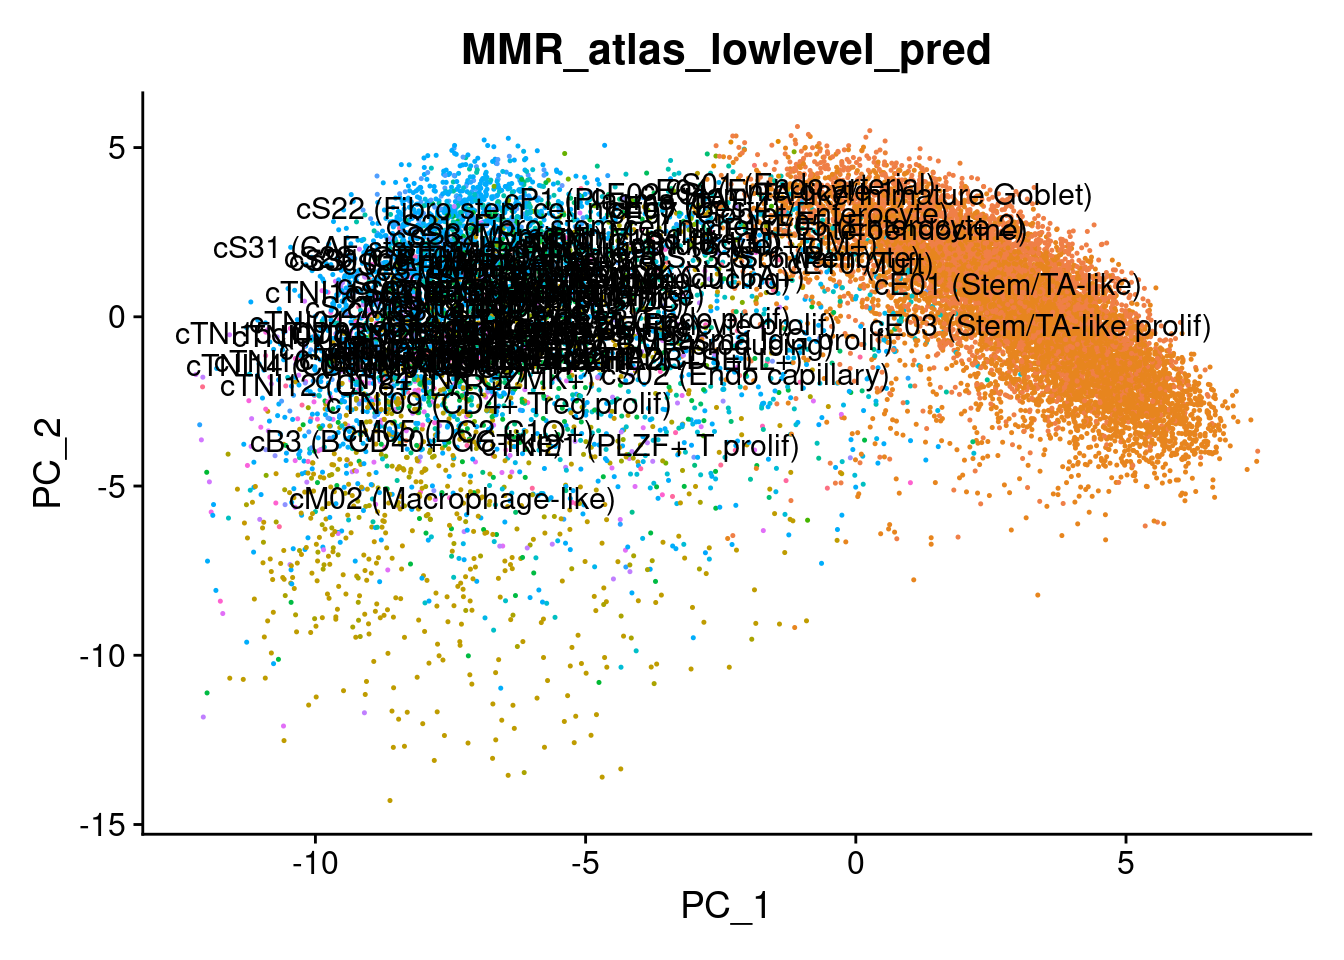
cropped.obj$MMR_atlas_lowlevel_pred <- predictions$labels
predictions <- SingleR(test=cropped.obj@assays$Xenium$counts,
ref=avg_expr_MMR_mid, labels=colnames(avg_expr_MMR_mid),
aggr.ref = F, num.threads = 10)
cropped.obj$MMR_atlas_midlevel_pred <- predictions$labels
# Add on the annotations for the gut cell atlas lowlevel
predictions_gut <- SingleR(test=cropped.obj@assays$Xenium$counts,
ref=avg_expr_gut, labels=colnames(avg_expr_gut),
aggr.ref = F, num.threads = 10)
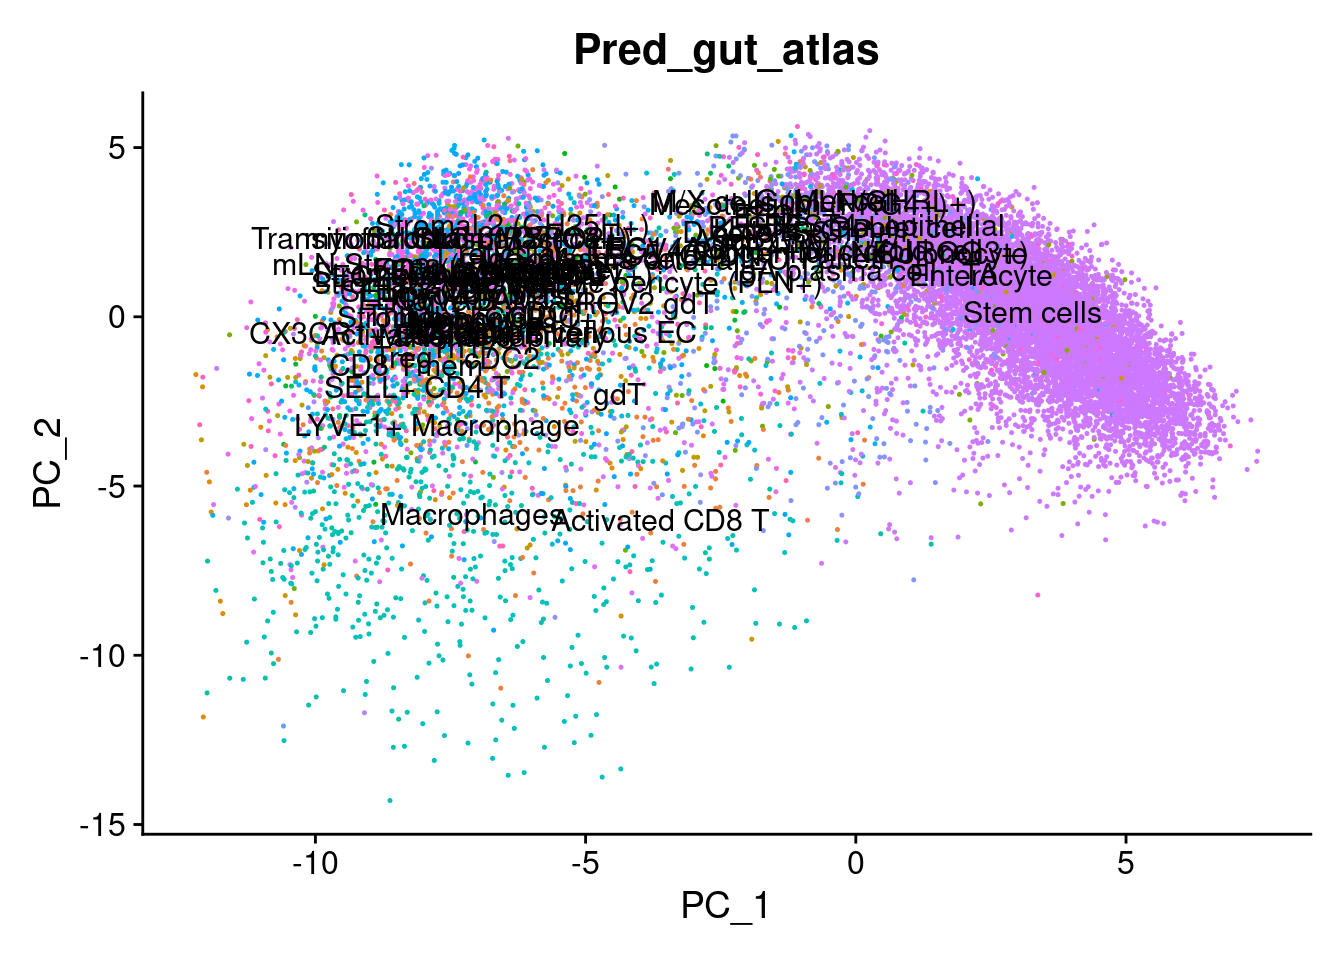
cropped.obj$Pred_gut_atlas <- predictions_gut$labels
# Add on the annotations for the gut cell atlas high level
predictions_gut_midlevel <- SingleR(test=cropped.obj@assays$Xenium$counts,
ref=avg_expr_gut_mid, labels=colnames(avg_expr_gut_mid),
aggr.ref = F, num.threads = 10)
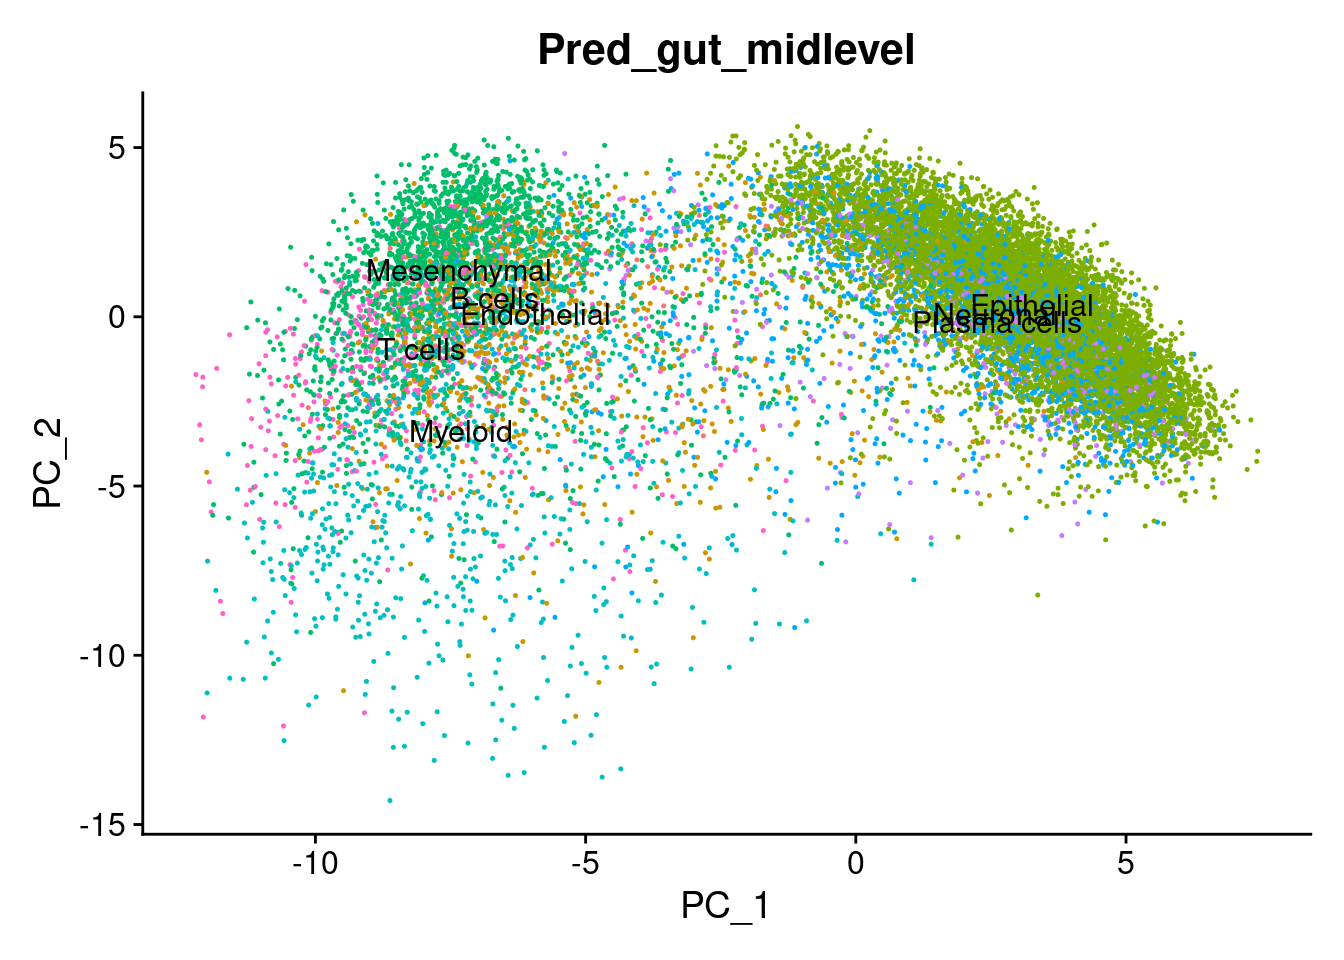
cropped.obj$Pred_gut_midlevel <- predictions_gut_midlevel$labels Visualise the annotations on the UMAP
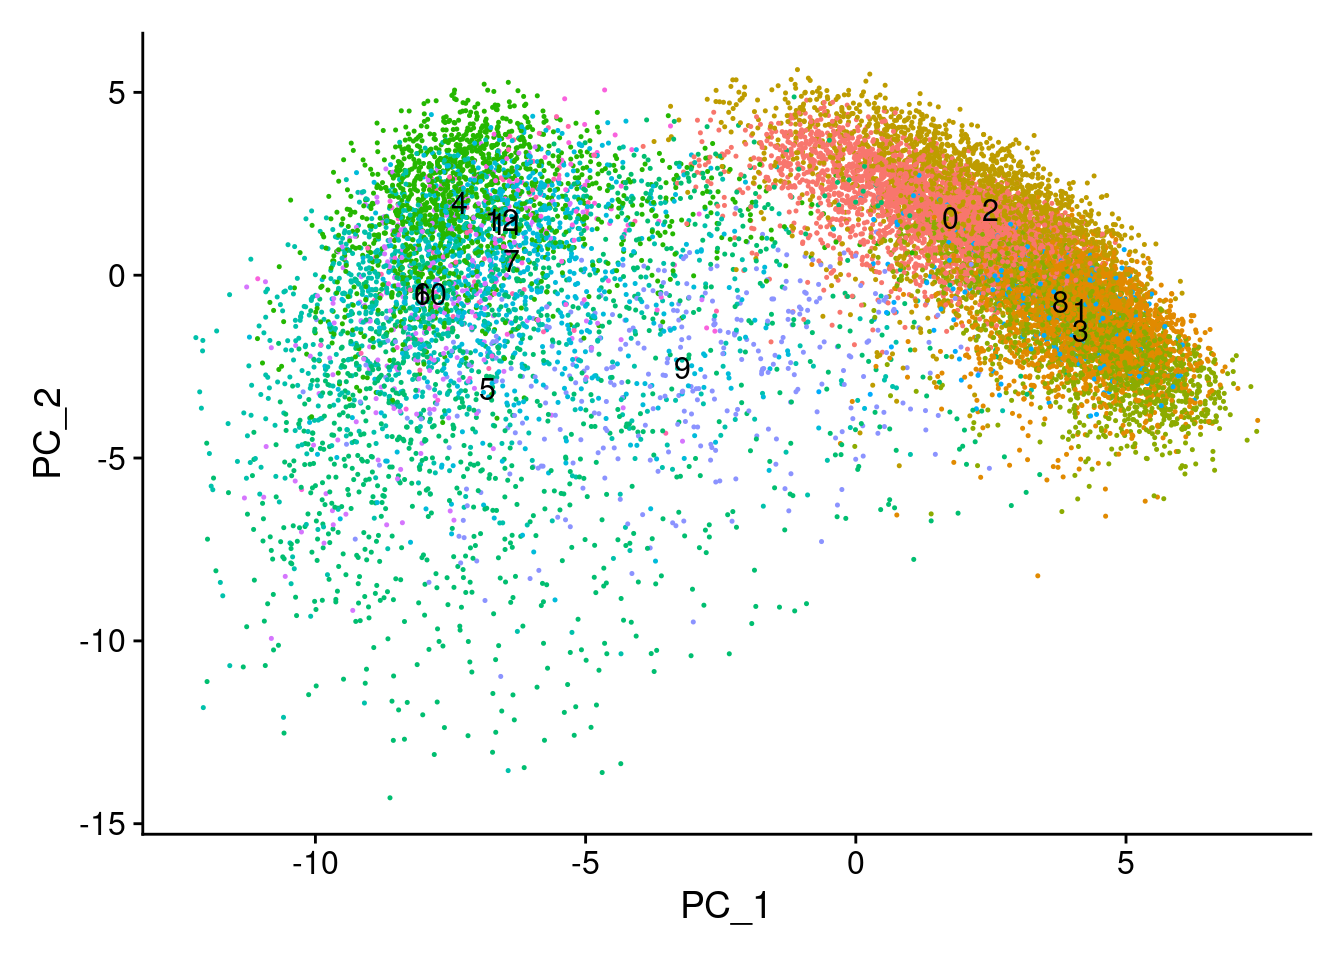
# Plot the automated annotations
DimPlot(cropped.obj, group.by = "MMR_atlas_midlevel_pred", label = T, cols = cell_type_colors)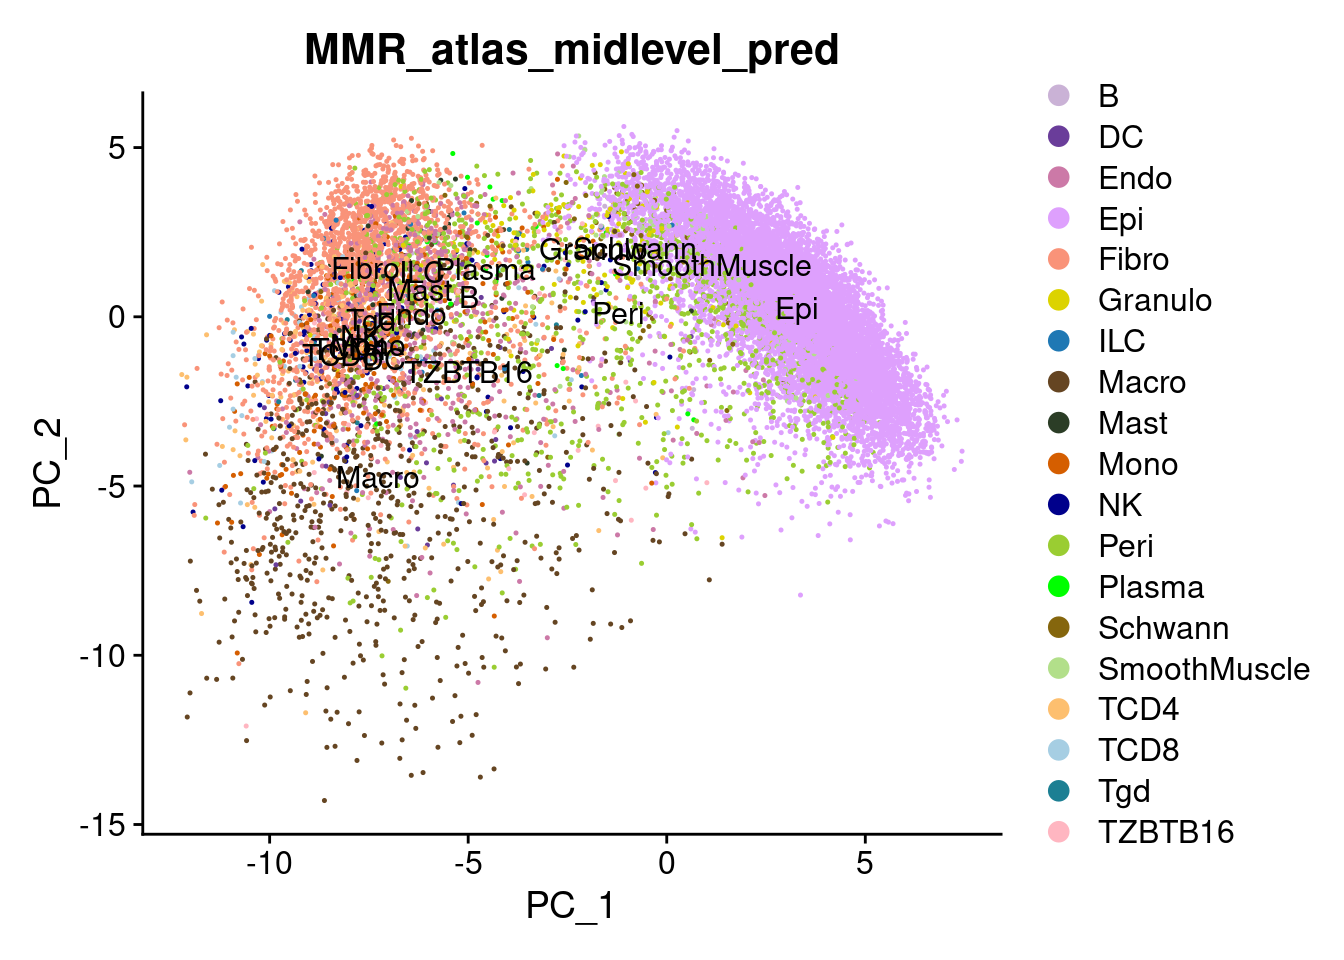
Plot some key marker genes of CRC and braod celltype markers
FeaturePlot(cropped.obj, features = c("PIGR", "LGR5", "OLFM4", "TGFBI", "MMP3", "REG1A", "REG3A", "BEST4", "MMP3"))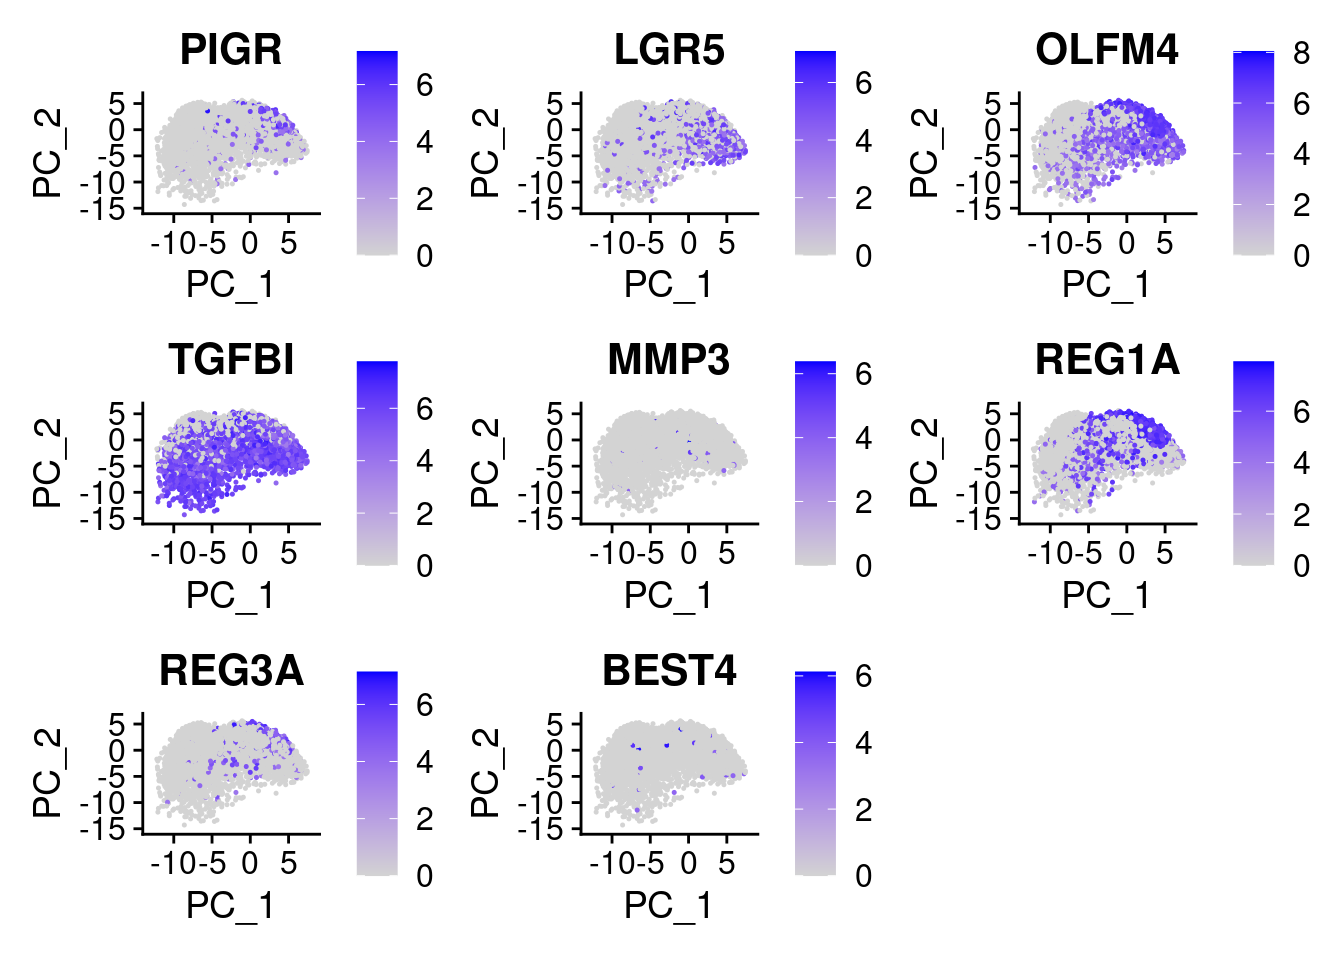
FeaturePlot(cropped.obj, features = c("CD8A", "CD3E", "SPP1", "C1QA", "CD79A", "MZB1"))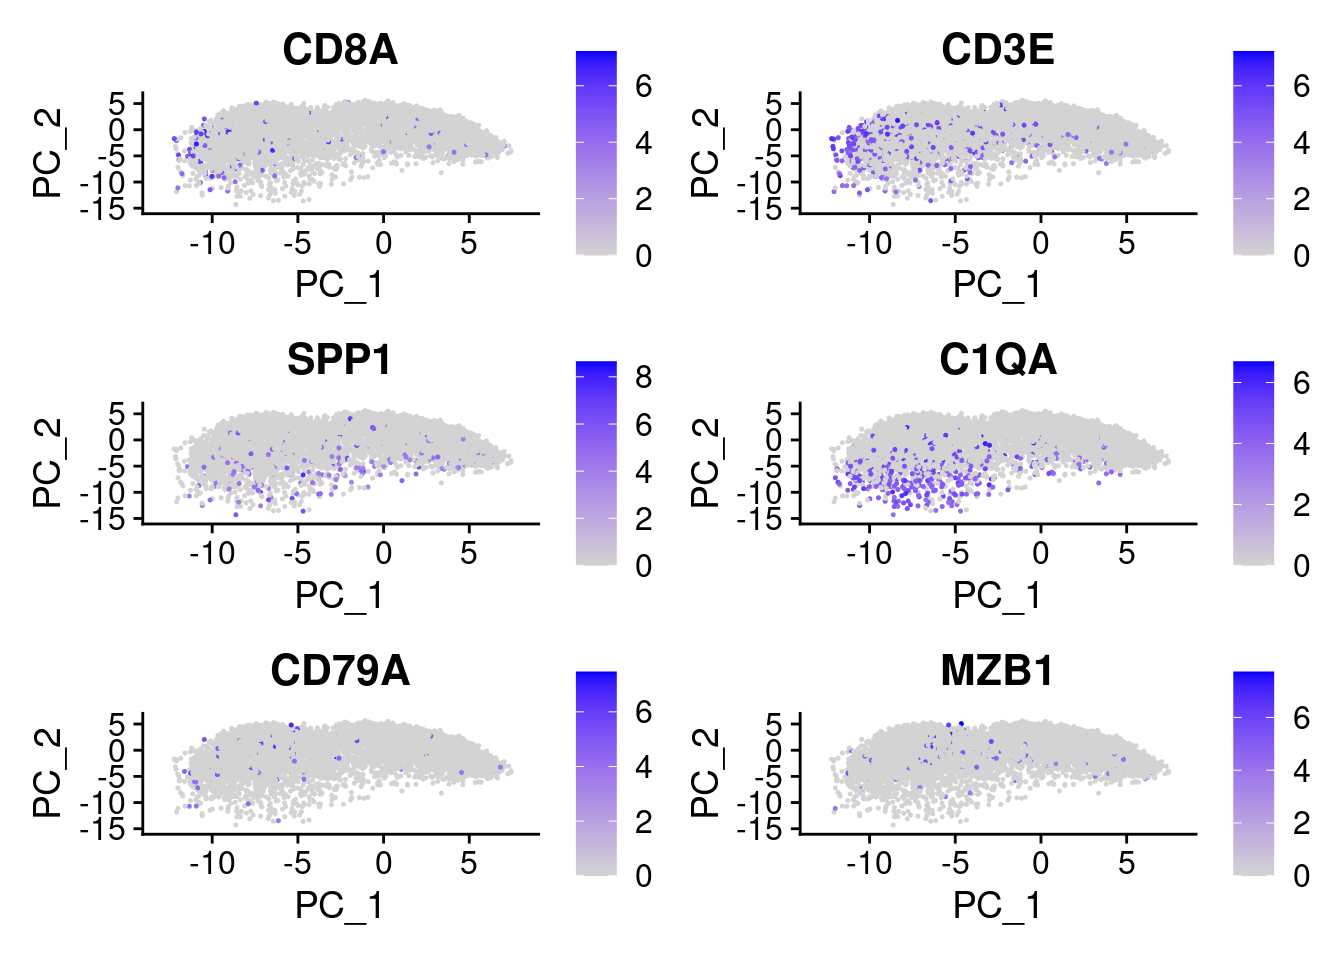
Summarise cell type annotations
cell_type_summary <- table(cropped.obj$Pred_gut_atlas, cropped.obj$Pred_gut_midlevel)%>%
  data.frame()
Plot the outputs on the slide
plot <- ImageDimPlot(cropped.obj,fov = "zoom", group.by = "Pred_gut_midlevel",
                     size = 0.3,
                     dark.background = T, boundaries = "segmentation",border.size = 0.1,
                     molecules = c("PIGR", "LGR5", "OLFM4", "TGFBI", "MMP3", "REG1A", "REG3A"),
                     nmols = 20000) +
  ggtitle("Cell type")

plot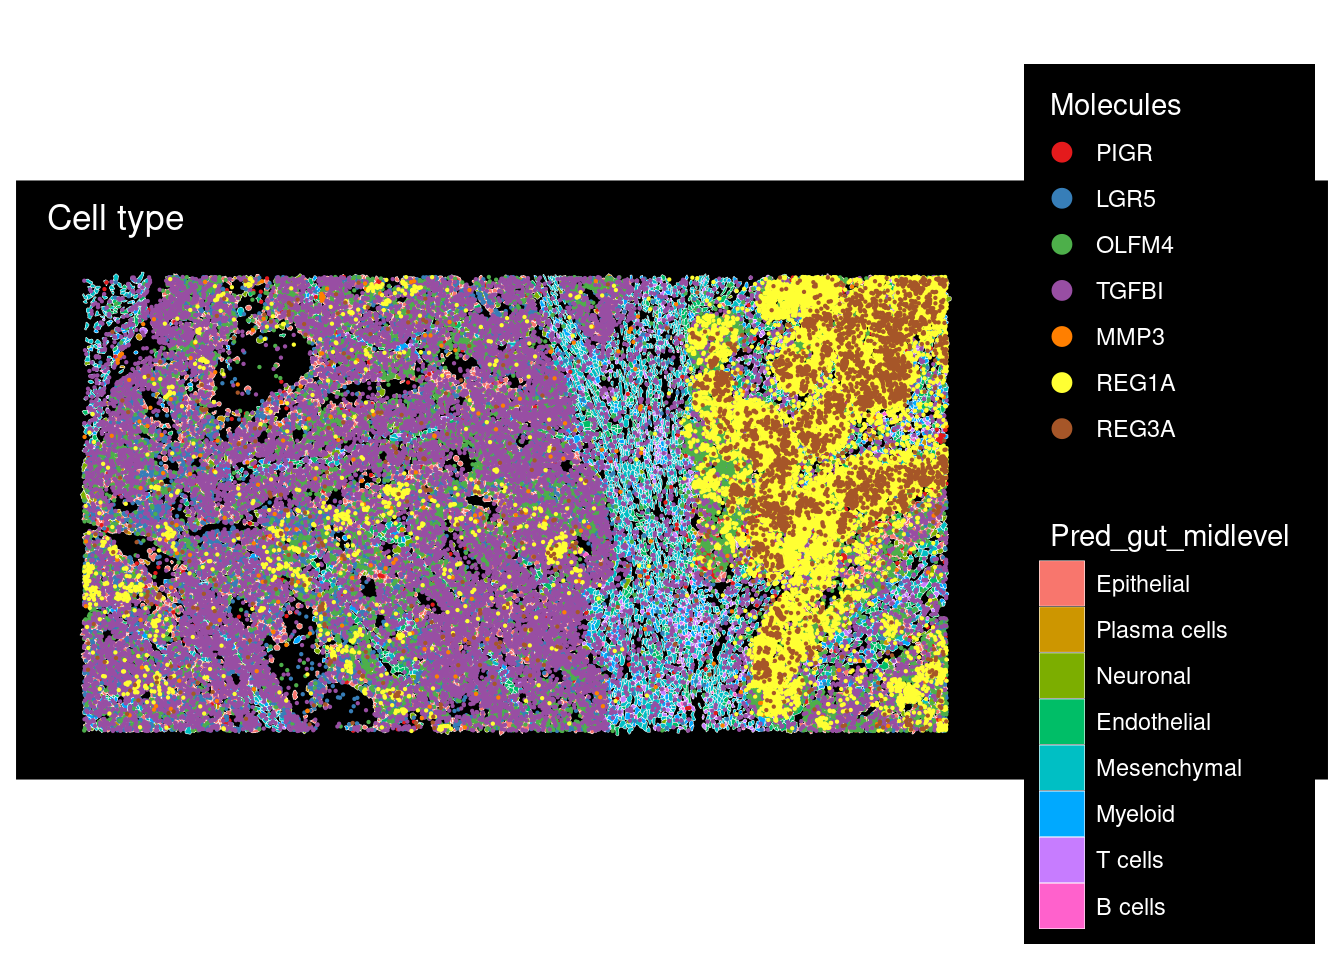
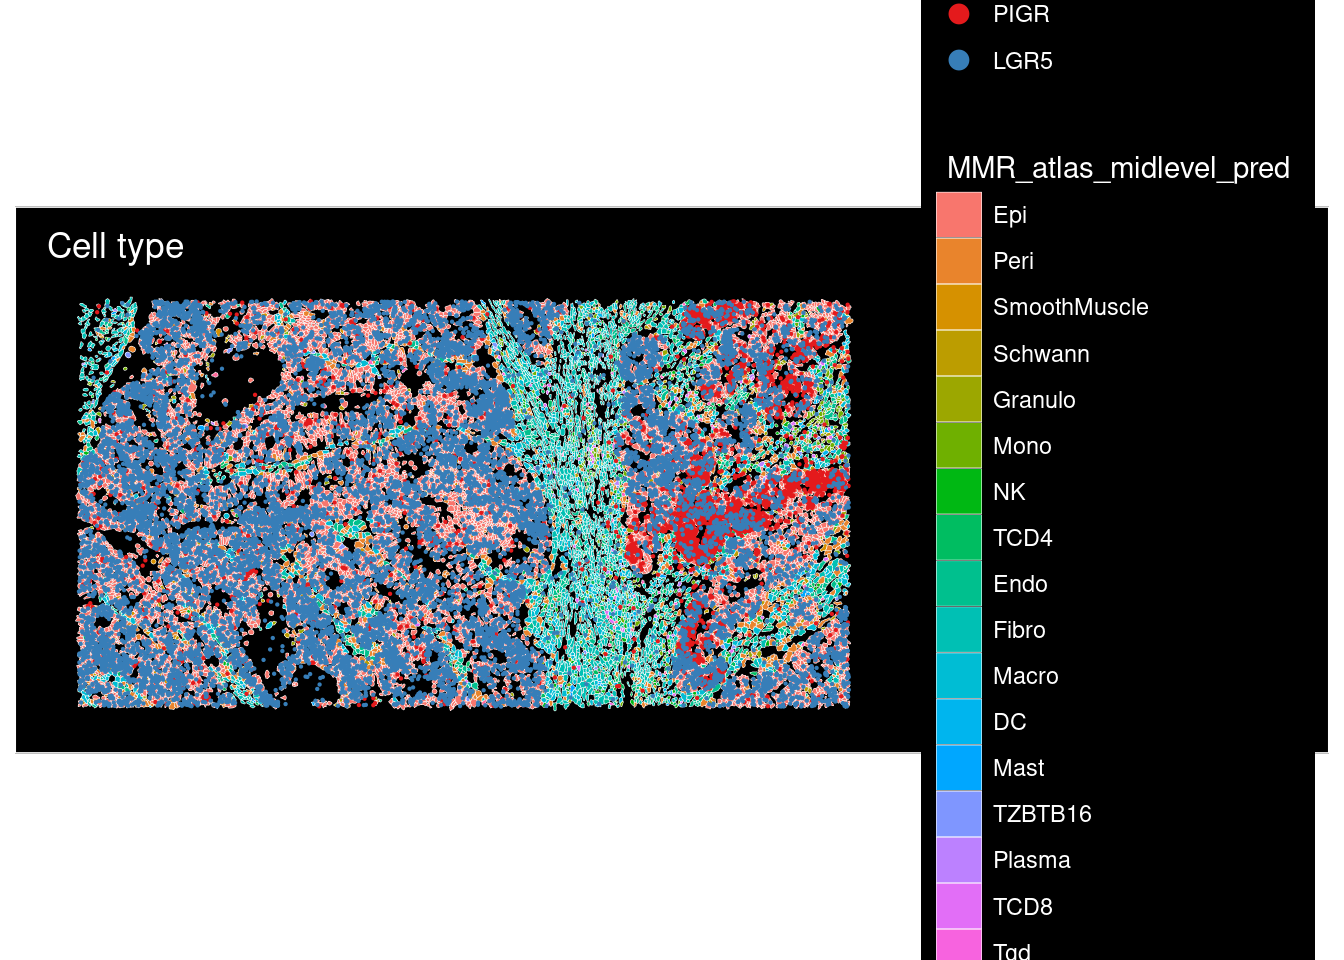
plot2 <- ImageDimPlot(cropped.obj,fov = "zoom", group.by = "MMR_atlas_midlevel_pred",
                     size = 0.3,
                     dark.background = T, boundaries = "segmentation",border.size = 0.1,
                     molecules = c("PIGR", "LGR5"),
                     nmols = 20000) +
  ggtitle("Cell type")

plot2