8 Pseudobulk differential gene expression between niches
Set up functions to be used later
# Plot the expression of a gene in all celltypes
plot_gene_celltype <- function(cpm, gene, bulk_anno, outdir, axes = T){

  # Make a plot of a single gene
  single_gene <- cpm[gene,]%>%
    data.frame(check.rows = F)%>%
    rownames_to_column("Slide_Niche_Cell")%>%
    dplyr::rename(CPM = 2)%>%
    left_join(bulk_anno)%>%
    group_by(Niche_Cell)%>%
    mutate(median_cpm = median(CPM))%>%
    ungroup()%>%
    arrange(-median_cpm)%>%
    mutate(Cell = factor(Cell, levels = unique(Cell)))

  plt <- ggplot(data = single_gene, aes(x = Cell, y = CPM))+
    geom_jitter(width = 0.1, height = 0, aes(colour = Cell), size = 1)+
    facet_wrap(~Niche)+
    guides(colour ="none")+
    blank_theme+
    theme(axis.text.x = element_text(angle = 90, vjust = 0.5, hjust=1))+
    labs(x = "Cell type", y = expression('Mean log'[2]*' CPM'), fill = "Sample")+
    stat_summary(fun = "median", fun.min = "median", fun.max= "median", linewidth= 0.3, geom = "crossbar")+
    scale_colour_manual(values = cell_type_colors)+
    ggtitle(gene)+
    theme(plot.title = element_text(face = "italic"))+
    coord_flip()

  ggsave(paste0(outdir, gene, " cell type expression.pdf"), width = 15, height = 25, limitsize = F)

  if(axes == F){
    plt <- plt+labs(x = NULL, y = NULL)
  }

}

# Set colours for cell type
cell_types <- c("Epi", "Plasma", "Fibro", "Peri", "Macro", "Granulo", "TCD4", "SmoothMuscle", "Endo",
                "B", "DC", "ILC", "Schwann", "Mast", "Mono", "TCD8", "NK", "TZBTB16", "Tgd","QC_fail")

colors <- c("#DEA0FD", "green", "#f99379", "yellowgreen","#654522" ,"#dcd300", "#fdbf6f", "#b2df8a" ,"#CC79A7","#cab2d6",
            "#6a3d9a", "#1f78b4", "#85660D", "#2b3d26","#D55E00", "#a6cee3","darkblue","lightpink", "#1C7F93",
            "grey")

cell_type_colors <- setNames(colors, cell_types)

# Define a function to shut up some other functions
quiet <- function(x) {
  sink(tempfile())
  on.exit(sink())
  invisible(force(x))
}

# Function to run GSEA for a contrast
run_GSEA <- function(contrast , collection, rnaseq, v, design, cont.matrix, pseudobulk_dir){

  collection_name <- gsub(".Hs.symbols.gmt|.gmt","", basename(collection))

  gene_set <- quiet(GSA.read.gmt(collection))
  gene_set_formatted <- gene_set$genesets
  names(gene_set_formatted) <- gene_set$geneset.names
  indexed <- ids2indices(gene.sets = gene_set_formatted, identifiers = rownames(rnaseq$counts), remove.empty=TRUE)

  camera_result <- camera(y = v ,index = indexed, design = design, contrast = cont.matrix[,contrast])%>%
    rownames_to_column("Gene set")%>%
    dplyr::select(`Gene set`,"NGenes" , "Direction", "PValue", "FDR")%>%
    filter(FDR <= 0.05)%>%
    mutate(Contrast= contrast)

  fry_result <- fry(y = v ,index = indexed, design = design, contrast = cont.matrix[,contrast])%>%
    rownames_to_column("Gene set")%>%
    dplyr::select(`Gene set`,"NGenes" , "Direction", "PValue", "FDR")%>%
    filter(FDR <= 0.05)%>%
    mutate(Contrast= contrast)

  # Make a directory
  system(paste0("mkdir -p ", pseudobulk_dir,"gsea/camera/"))
  system(paste0("mkdir -p ", pseudobulk_dir,"gsea/fry/"))

  write_csv(camera_result, paste0(pseudobulk_dir,"gsea/camera/",collection_name, "_", contrast,".csv"))
  write_csv(fry_result, paste0(pseudobulk_dir,"gsea/fry/",collection_name, "_", contrast,".csv"))
}
Plot the cell type proportions of each niche
# Read the niche proportions and annotate cellular niches
niche_props <- list.files("./data/Xenium/preprocessed/pseudobulk_inputs//",pattern = "*_niches.csv",
                          full.names = T)

niche_props
#> [1] "./data/Xenium/preprocessed/pseudobulk_inputs///P1_MMR_niches.csv"
#> [2] "./data/Xenium/preprocessed/pseudobulk_inputs///P2_MMR_niches.csv"
#> [3] "./data/Xenium/preprocessed/pseudobulk_inputs///P5_MMR_niches.csv"

# Read all the files
read_list <- lapply(niche_props, read.csv)

head(read_list[[1]])
#>   MMR_atlas_midlevel_pred Niche  Total Count Niche_pct
#> 1                       B    N0 213110  9310  4.368636
#> 2                      DC    N0 213110  2209  1.036554
#> 3                    Endo    N0 213110 14792  6.941016
#> 4                     Epi    N0 213110 81233 38.117873
#> 5                   Fibro    N0 213110 37290 17.498006
#> 6                 Granulo    N0 213110  2510  1.177796
#>   Sample
#> 1    P1_
#> 2    P1_
#> 3    P1_
#> 4    P1_
#> 5    P1_
#> 6    P1_

head(rownames(read_list[[1]]) == rownames(read_list[[2]]))
#> [1] TRUE TRUE TRUE TRUE TRUE TRUE

# Get the correct rowname reference order (from the first matrix)
ref_rownames <- rownames(read_list[[1]])

# Reorder each matrix to match the reference
reordered_list <- lapply(read_list, function(mat) {
  mat[ref_rownames, , drop = FALSE]
})

# cbind to combine columns
combined_niches <- do.call(rbind, reordered_list)%>%
  arrange(Niche, Sample)%>%
  mutate(Sample_niche = paste0(Sample, Niche))%>%
  mutate(Sample_niche = factor(Sample_niche, levels = unique(Sample_niche)))%>%
  write_csv("./data/Xenium/preprocessed/combined_niches.csv")

combined_niches_subset <- combined_niches%>%
  filter(Niche %in% c("N0", "N1", "N2", "N3", "N50", "N100", "N200", "N35", "N36"))

ggplot(data = combined_niches_subset, aes(x = Sample_niche, y = Niche_pct, fill = MMR_atlas_midlevel_pred))+
  facet_wrap(~Niche, scales = "free")+
  geom_bar(stat = "identity")+
  labs(x = "Niche", y = "Celltype % of niche", fill = "Cell type")+
  blank_theme+
  scale_fill_manual(values = cell_type_colors)+
  theme(axis.text.x = element_text(angle = 90, vjust = 0.5, hjust=1))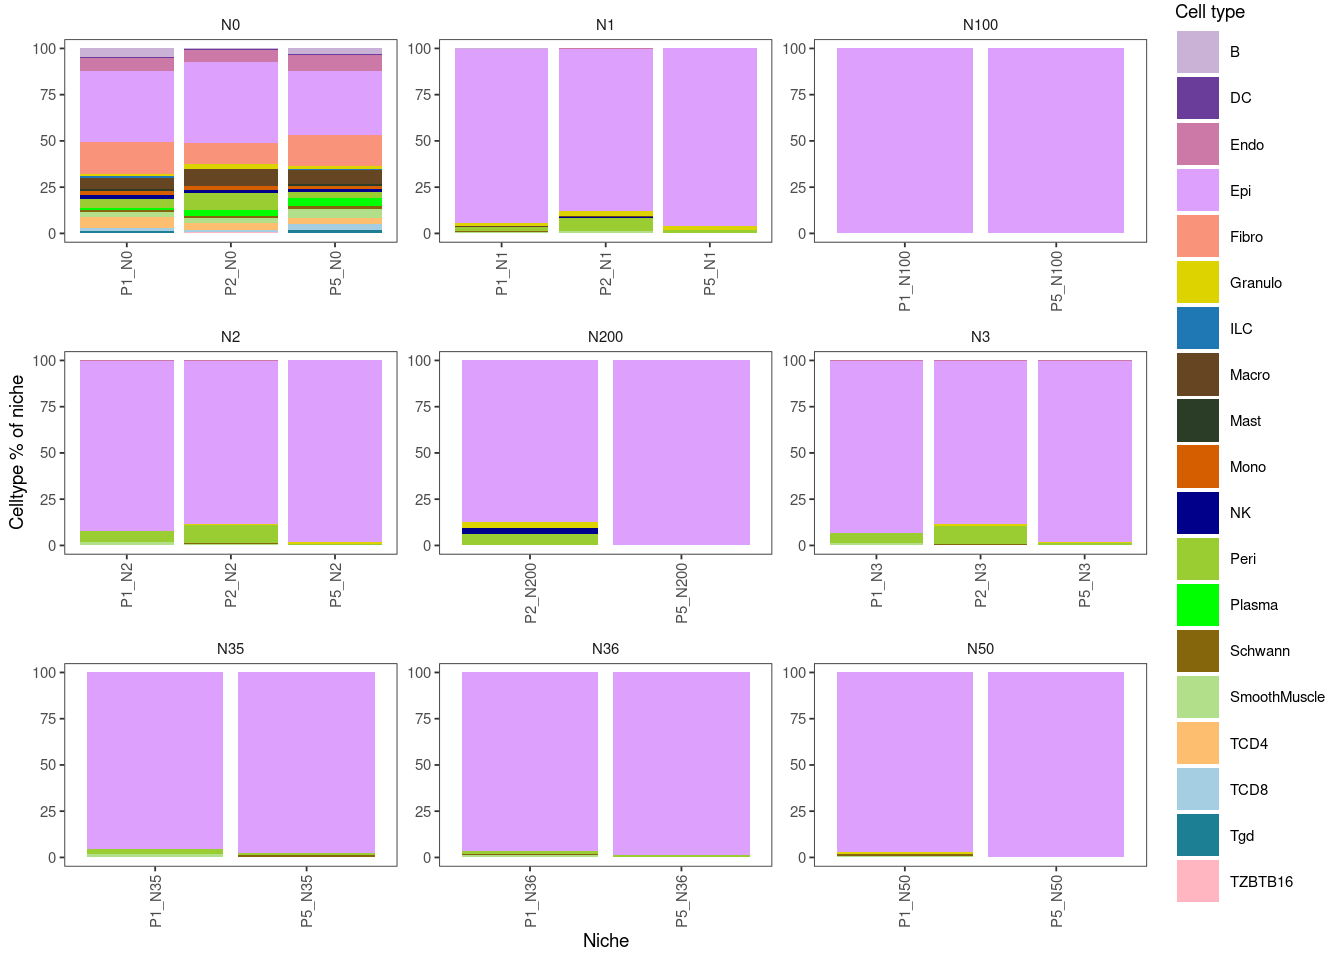
Set up the pseudobulk counts
# Read the pseudobulk counts
pb_files <- list.files("./data/Xenium/preprocessed/pseudobulk_inputs/",pattern = "*.qs",
                       full.names = T)

# Read all the files
read_list <- lapply(pb_files, qread)

identical(rownames(read_list[[1]]), rownames(read_list[[2]]))
#> [1] TRUE
identical(rownames(read_list[[1]]), rownames(read_list[[3]]))
#> [1] TRUE

# cbind to combine columns
combined <- do.call(cbind, read_list)

pseudobulk_dir <- "./data/Xenium/preprocessed/pseudobulk/output/"

system(paste0("mkdir -p ", pseudobulk_dir, "/plots/"))

combined[1:5,1:5]
#> 5 x 5 sparse Matrix of class "dgCMatrix"
#>        P1_N0_B P1_N0_DC P1_N0_Endo P1_N0_Epi P1_N0_Fibro
#> ABCC8       92       10        111       643         187
#> ACP5      1408      324        759      1905        4719
#> ACTA2     2476     1119      16666     23845       55359
#> ADH1C      306       45        418      9108        2234
#> ADRA2A     349       63        821     14490        1725

# Remove spaces that break limma
colnames(combined) <- gsub(" |%|\\+|\\)|\\(|\\/", "",colnames(combined))

combined[1:5,1:5]
#> 5 x 5 sparse Matrix of class "dgCMatrix"
#>        P1_N0_B P1_N0_DC P1_N0_Endo P1_N0_Epi P1_N0_Fibro
#> ABCC8       92       10        111       643         187
#> ACP5      1408      324        759      1905        4719
#> ACTA2     2476     1119      16666     23845       55359
#> ADH1C      306       45        418      9108        2234
#> ADRA2A     349       63        821     14490        1725

# Set up the annotation and keep tumour only
bulk_anno <- data.frame(Slide_Niche_Cell = colnames(combined))%>%
  separate(Slide_Niche_Cell, into = c("Slide", "Niche", "Cell"),sep = "_",remove = F)%>%
  mutate(Niche = gsub("–", "_",Niche ))%>%
  mutate(Cell = gsub("–", "_",Cell ))%>%
  mutate(Niche_Cell = paste0(Niche, "_", Cell))

#bulk_anno <- read_csv(paste0(pseudobulk_dir, "Pseudobulk_annotation.csv"))

# Make a DGElist
rnaseq <- DGEList(combined[,bulk_anno$Slide_Niche_Cell])

# Remove weird characters

# Sanity check
all.equal(colnames(rnaseq), bulk_anno$Slide_Niche_Cell)
#> [1] TRUE
Limma design matrix and linear model fit
design <- model.matrix(~0 + Niche_Cell, data = bulk_anno)

# Neaten up design row and colnames
colnames(design) <- gsub("Niche_Cell", "", colnames(design))
rownames(design) <- rownames(rnaseq$samples)

hist(as.matrix(combined), breaks = 100000, xlim = c(0,200))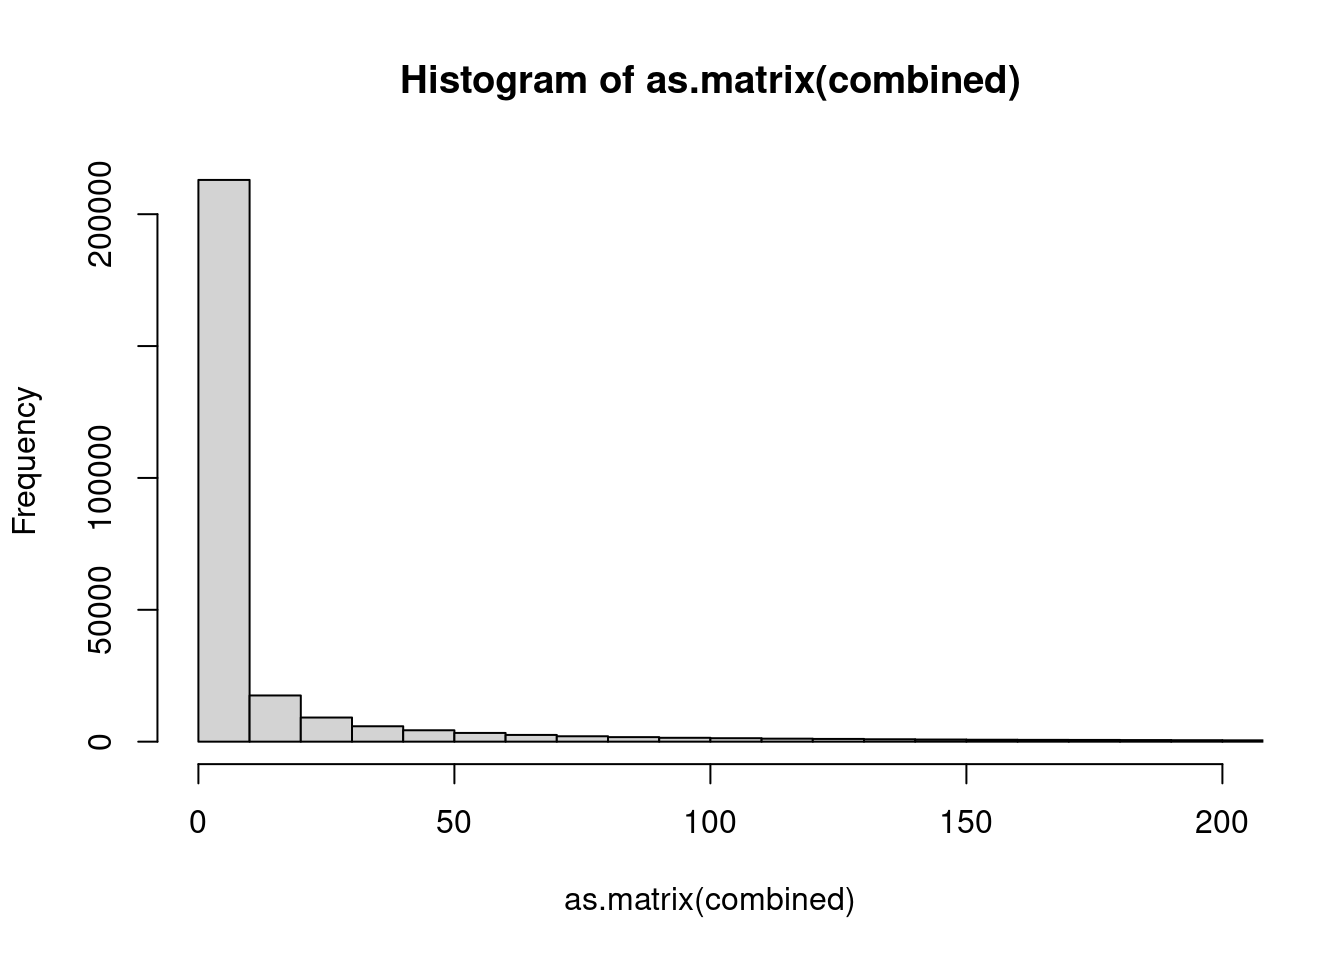
keep <- filterByExpr(rnaseq, design = design, min.count = 10)
table(keep)
#> keep
#> FALSE  TRUE
#>    88   334
#rnaseq <- rnaseq[keep,, keep.lib.sizes=FALSE]

rnaseq <- calcNormFactors(rnaseq)

# Save the counts as a reference for single cell
cpm <- cpm(rnaseq, log =T)
qsave(cpm, paste0(pseudobulk_dir, "Pseudobulk_log2_CPMs.qs"))

# Do a glimma MDS of batch removed counts
system(paste0("mkdir -p ", pseudobulk_dir,"glimma/mds/"))

# Save and MDS plot per cell type
for(celltype in unique(bulk_anno$Cell)){

  print(celltype)

  mds_save <- paste0(paste0(pseudobulk_dir,"glimma/mds/", celltype, "_MDS.html"))

  bulk_filt <- bulk_anno%>%
    filter(Cell == celltype)

  rseq_filt <- cpm[,bulk_filt$Slide_Niche_Cell]

  if(ncol(rseq_filt) <3){
    next
  }

  htmlwidgets::saveWidget(glimmaMDS(rseq_filt, groups = bulk_filt,
                                    labels = bulk_filt$Niche_Cell), mds_save)
}
#> [1] "B"
#> [1] "DC"
#> [1] "Endo"
#> [1] "Epi"
#> [1] "Fibro"
#> [1] "Granulo"
#> [1] "ILC"
#> [1] "Macro"
#> [1] "Mast"
#> [1] "Mono"
#> [1] "NK"
#> [1] "Peri"
#> [1] "Plasma"
#> [1] "Schwann"
#> [1] "SmoothMuscle"
#> [1] "TCD4"
#> [1] "TCD8"
#> [1] "Tgd"
#> [1] "TZBTB16"

# Weird voom mean-variance
v <- voom(rnaseq, design = design, plot = T)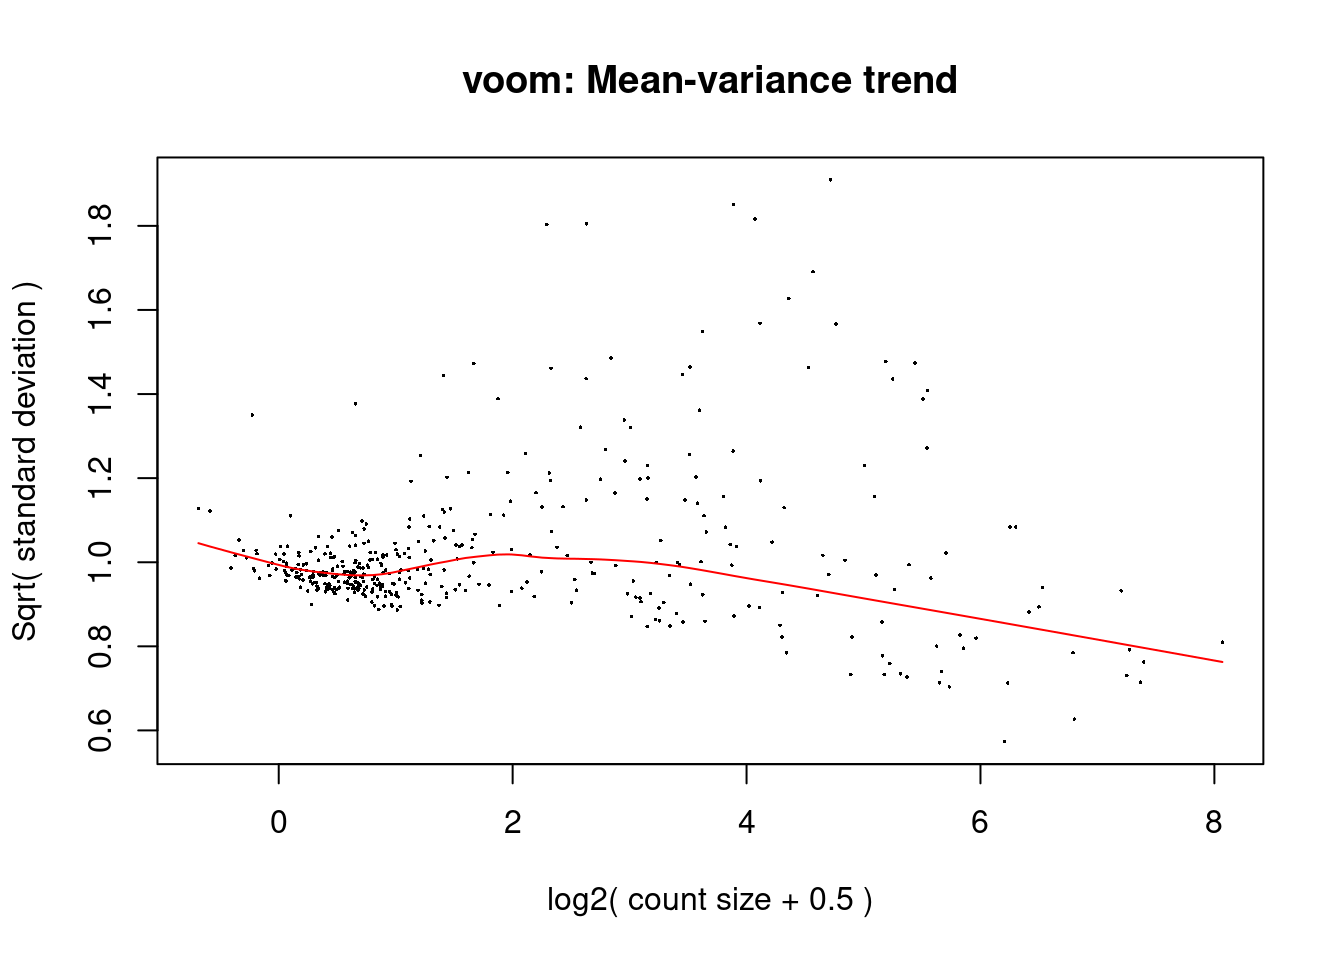
Automated contrast matrix for all cell types over all niches
# Automate a contrast matrix
# Compare each niche to all other niches
niches <- unique(bulk_anno$Niche)

head(colnames(design))
#> [1] "N0_B"       "N0_DC"      "N0_Endo"    "N0_Epi"
#> [5] "N0_Fibro"   "N0_Granulo"

contrast_lines <- character()
i2 <- 0
for(i in 1:length(unique(bulk_anno$Cell))){

  cell_type <- unique(bulk_anno$Cell)[i]

  # Look over all the contrasts assuming the first is the baseline
  for(i3 in 1:length(niches)){

    contrast_1 <- niches[i3]
    contrast_2 <- niches[niches != contrast_1]
    contrast_2 <- paste0(contrast_2, "_", cell_type)
    contrast_1 <- paste0(contrast_1, "_", cell_type)

    # Make sure the contrast/cell combo is present
    contrast_2 <- contrast_2[contrast_2 %in% colnames(design)]

    if(contrast_1 %in% colnames(design) & (length(contrast_2) > 0)){

      i2 <- i2+1

      clen <- length(contrast_2)
      # Make a combined contrast2 (all conditions/length)
      contrast_2 <- paste0(contrast_2, collapse = "+")
      contrast_2 <- paste0("(",contrast_2, ")/",clen)

      # Test condition - baseline
      contrast_line <- paste0(contrast_1, "-", contrast_2)

      #print(contrast_line)

      contrast_lines[i2] <- c(contrast_line)

    }

  }

}

cont.matrix <- eval(as.call(c(as.symbol("makeContrasts"),as.list
                              (contrast_lines),levels=list(design))))

colnames(cont.matrix) <- gsub("-.*", "", colnames(cont.matrix))

hist(colSums(cont.matrix), xlim = c(-1,1))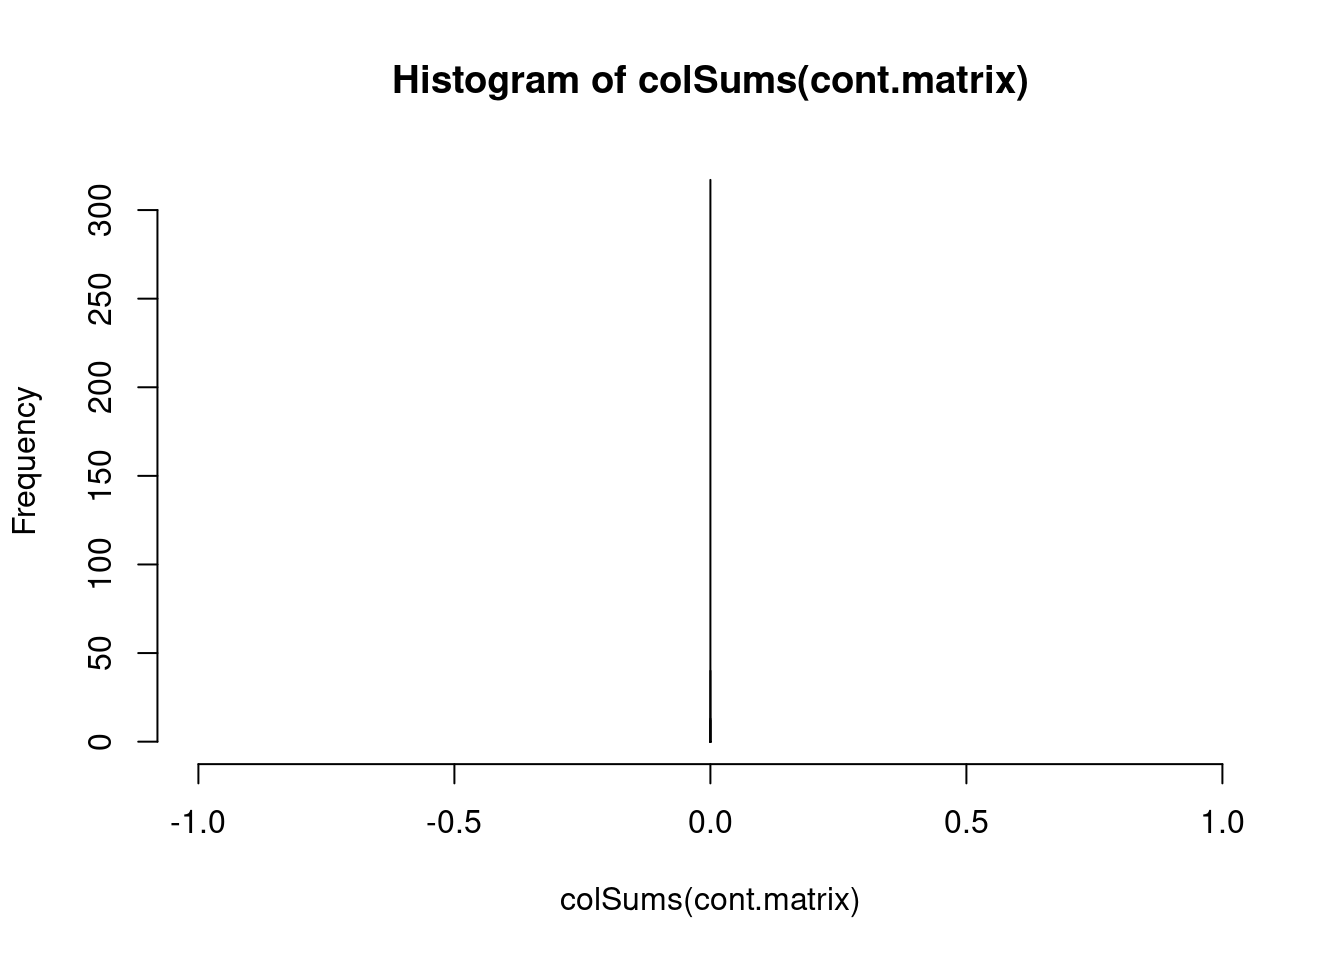
fit.cont <- contrasts.fit(fit, cont.matrix)
fit.cont <- eBayes(fit.cont)
summa.fit <- decideTests(fit.cont)
#summary(summa.fit)

de_summary <- data.frame(summary(summa.fit), check.names = F)%>%
  dplyr::select(Contrast = 2, `Direction if significant` = 1, `Number of genes` = 3)%>%
  mutate(`Direction if significant` = factor(`Direction if significant`, levels = c("Up", "Down", "NotSig")))%>%
  arrange(`Direction if significant`, `Number of genes`)%>%
  write_csv(paste0(pseudobulk_dir, "Significant_genes_summary.csv"))

plot_summary <- de_summary %>%
  filter(`Direction if significant`!= "NotSig")%>%
  filter(`Number of genes` >0)%>%
  group_by(Contrast)%>%
  mutate(Total_genes = sum(`Number of genes`))%>%
  ungroup()%>%
  mutate(`Number of genes` = replace(`Number of genes`, `Direction if significant` == "Down", `Number of genes`[`Direction if significant` == "Down"] *-1))%>%
  arrange(-Total_genes)%>%
  mutate(Contrast = gsub("_", " ", Contrast))%>%
  mutate(Contrast = factor(Contrast, levels = unique(Contrast)))

ggplot(data = plot_summary, aes(y = Contrast, x = `Number of genes`, fill = `Direction if significant`))+
  geom_bar(stat = "identity")+
  blank_theme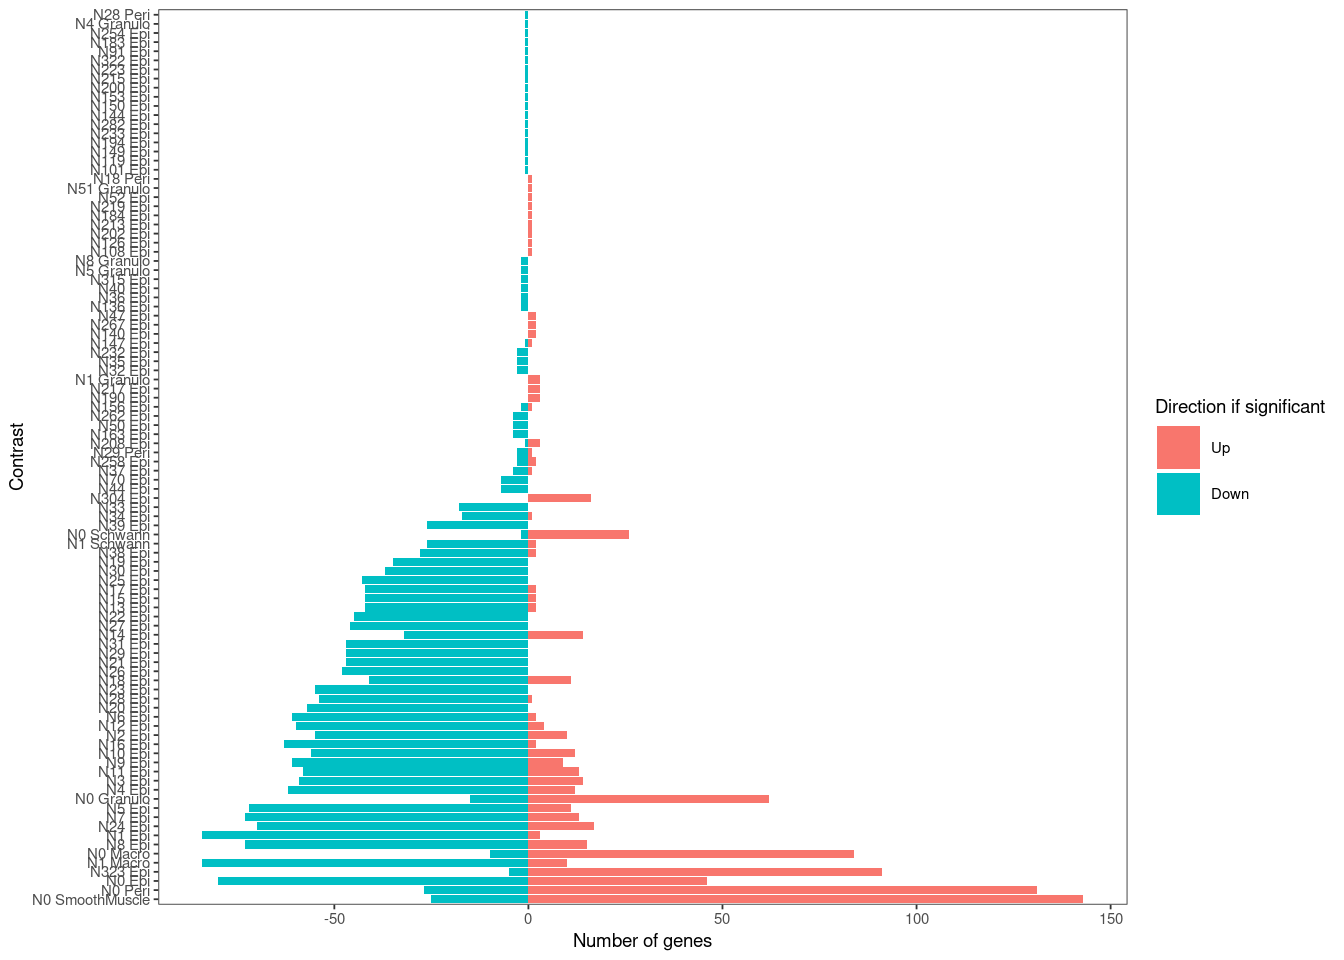
Limma toptables and glimma MA/volcano plots
# Make the output directory
system(paste0("mkdir -p ", pseudobulk_dir, "/toptables/"))
#system(paste0("rm ", pseudobulk_dir, "/toptables/*.csv"))

VOL <- paste0(pseudobulk_dir, "Volcano_plots/")
system(paste0("mkdir -p ", VOL))

# Make a vector of all contrast types to remove

VOL <- paste0(pseudobulk_dir, "glimma/volcano/")
MA <- paste0(pseudobulk_dir, "glimma/MA/")
system(paste0("mkdir -p ", VOL))
system(paste0("mkdir -p ", MA))

# Get all the toptables
for(contrast in colnames(cont.matrix)){

  output <- paste0(pseudobulk_dir, "toptables/", contrast, ".csv")

  toptable <- topTable(fit.cont,coef=contrast,sort.by="p",number = Inf)%>%
    rownames_to_column("SYMBOL")%>%
    write_csv(output)

  if(grepl("_Epi", contrast)){
    next()

  }

  # Get the celltype in
  celltype_plot <- gsub(".*_", "",contrast)

  # Get just the cells of the selected celltype
  bulk_filt <- bulk_anno%>%
    filter(Cell == celltype_plot)

  cpm_filt <- cpm[,bulk_filt$Slide_Niche_Cell]

  MA_fac <- factor(bulk_filt$Niche_Cell, levels = unique(bulk_filt$Niche_Cell))

  vol_save <- paste0(pseudobulk_dir, "glimma/volcano/",contrast,"_", "glimma_volcano.html")
  htmlwidgets::saveWidget(glimmaVolcano(fit.cont, coef = contrast, main = contrast,
                                        counts = cpm_filt, transform.counts = "none",
                                        groups = MA_fac), vol_save)

  MA_save <- paste0(pseudobulk_dir, "glimma/MA/",contrast,"_", "glimma_MA.html")
  htmlwidgets::saveWidget(glimmaMA(x = fit.cont, coef = contrast,main = contrast,
                                        counts = cpm_filt,transform.counts = "none",
                                        groups = MA_fac), MA_save)

}

# Drop the glimma files
system(paste0("rm -r ",pseudobulk_dir, "/glimma/*/*_files"))

# Compile the toptables to compare with CPDB
all_toptables <- list.files(paste0(pseudobulk_dir, "toptables/"), full.names = T)

tt_list <- list()
for(i in 1:length(all_toptables)){

  contrast <- gsub(".csv", "", basename(all_toptables[i]))

  tt <- read_csv(all_toptables[i])%>%
    mutate(contrast = contrast)%>%
    filter(adj.P.Val < 0.05)

  tt_list[[i]] <- tt


}

# Compile toptables and save the significant results
toptables_signif <- bind_rows(tt_list)%>%
  group_by(SYMBOL)%>%
  mutate(Gene_DE_N_times = n())%>%
  ungroup()%>%
  arrange(adj.P.Val)%>%
  mutate(Cell_type = gsub(".*_", "", contrast))%>%
  write_csv(paste0(pseudobulk_dir, "Compiled_toptables_significant_genes.csv"))

plot_gene_celltype (cpm, "IL1RN", bulk_anno, paste0(pseudobulk_dir,"plots/"), axes = F)
plot_gene_celltype (cpm, "DES", bulk_anno, paste0(pseudobulk_dir,"plots/"), axes = F)
plot_gene_celltype (cpm, "ITLN1", bulk_anno, paste0(pseudobulk_dir,"plots/"), axes = F)
plot_gene_celltype (cpm, "CLCA1", bulk_anno, paste0(pseudobulk_dir,"plots/"), axes = F)
Gene set enrichment analysis
gsea_gmt_dir <- "./data/Xenium/preprocessed/Reference/"
collections <- list.files(gsea_gmt_dir, full.names = T,pattern = "*.symbols.gmt")
collections <- collections[keep]
# Add on my fetal signature
collections <- c(collections,"./data/Xenium/preprocessed/Reference/Fetal_gene_sigs.gmt")

# Make a directory
system(paste0("mkdir -p ", pseudobulk_dir,"gsea/camera/"))

# Loop over gene sets and run GSEA for each contrast
for(collection in collections){
  print(collection)

  mclapply(X = colnames(cont.matrix),run_GSEA, collection, rnaseq, v, design,
           cont.matrix, pseudobulk_dir = pseudobulk_dir, mc.cores = 10)

}

# Save some gene sets to to plot/to use as DE in other datasets
# Compile the camera results
all_camera <- list.files(paste0(pseudobulk_dir,"gsea/camera/"), full.names = T)

clist <- list()
for(i in 1:length(all_camera)){

  contrast <- gsub("\\.csv", "", basename(all_camera[i]))

  tt <- read_csv(all_camera[i], col_types = cols(.default = "c"))%>%
    mutate(contrast = contrast)%>%
    select(-Contrast)

  clist[[i]] <- tt

}

# Compile toptables and save the significant results
camera_compiled <- bind_rows(clist)%>%
  mutate(FDR = as.numeric(FDR))%>%
  arrange(FDR)%>%
  write_csv(paste0(pseudobulk_dir, "Compiled_significant_gene_sets_camera.csv"))