5 Normalisation and dimensionality reduction
Just got back to 1 worker for this analysis seems to work much better
plan("multisession", workers = 1)Log normalise
cropped.obj <- NormalizeData(cropped.obj)
cropped.obj <- FindVariableFeatures(cropped.obj, selection.method = "vst")
Identify the 20 most highly variable genes
t20 <- head(VariableFeatures(cropped.obj), 20)
t20
#>  [1] "CXCL10"  "SPP1"    "IGHG3"   "REG1A"   "GREM1"
#>  [6] "VWF"     "HLA-DRA" "C3"      "RGS5"    "PLVAP"
#> [11] "CXCL9"   "PIGR"    "DMBT1"   "REG3A"   "MMP11"
#> [16] "MMP12"   "MMP2"    "CXCL11"  "IGFBP7"  "MMP7"
Scale data and run PCA
cropped.obj <- ScaleData(cropped.obj)
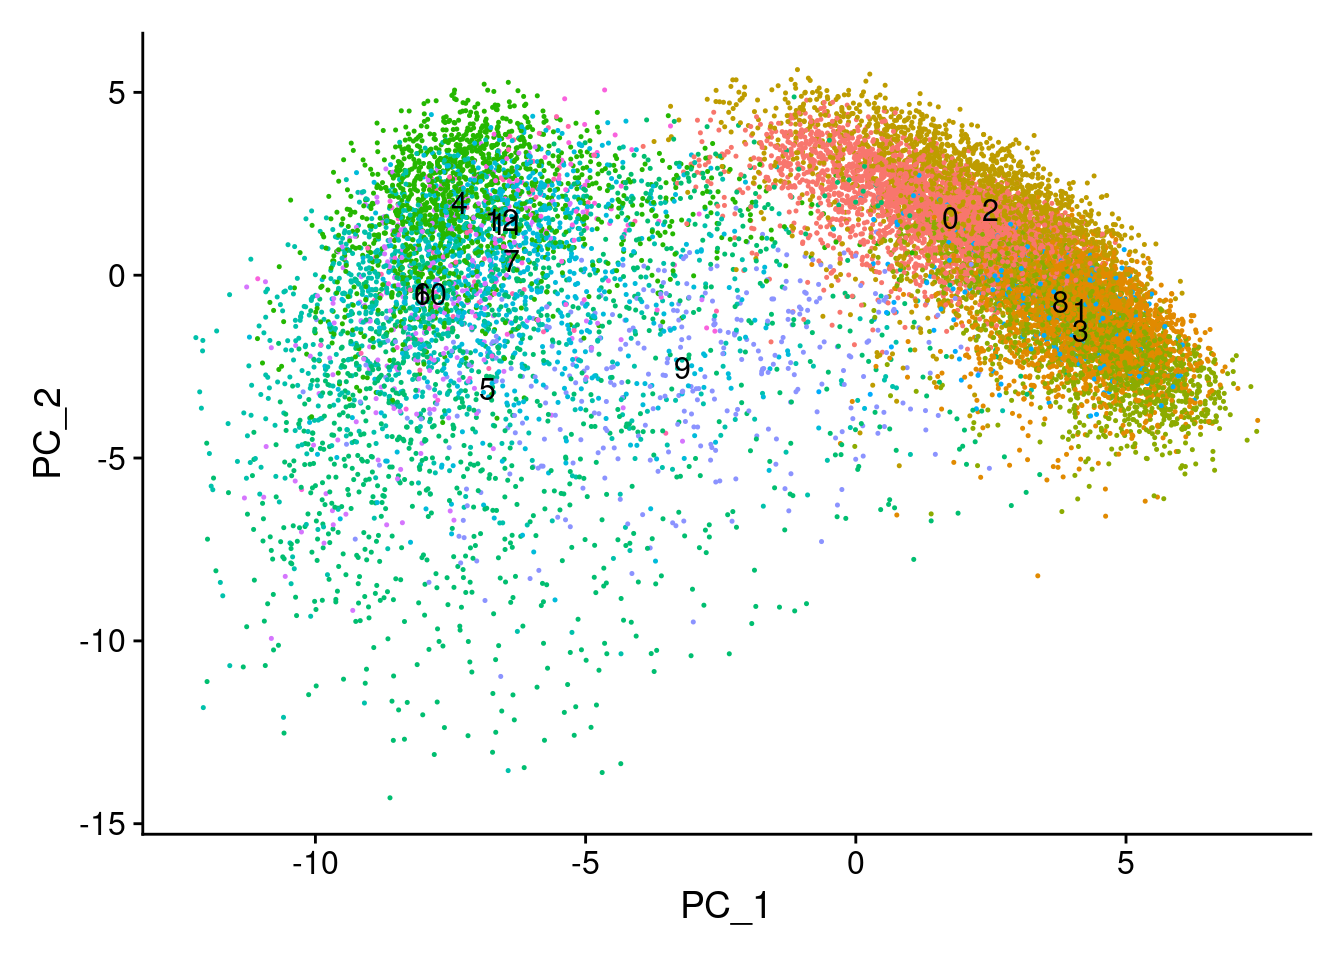
cropped.obj <- RunPCA(cropped.obj, features = VariableFeatures(object = cropped.obj))
print(cropped.obj[["pca"]], dims = 1:5, nfeatures = 5)
#> PC_ 1
#> Positive: GPX2, MUC17, CEACAM5, SLC12A2, CFTR
#> Negative: MMP2, IGFBP7, HLA-DRA, C3, GREM1
#> PC_ 2
#> Positive: DMBT1, REG1A, REG3A, LCN2, PIGR
#> Negative: C1QC, MS4A7, MMP12, HLA-DPB1, CTSB
#> PC_ 3
#> Positive: CD2, CD3G, TRBC2, CD3E, GZMA
#> Negative: PRSS23, TIMP3, THBS1, NOTCH3, FRZB
#> PC_ 4
#> Positive: STAB1, C1QC, MS4A7, REG1A, CD163
#> Negative: CD2, CD3E, TRAC, TRBC2, CD3G
#> PC_ 5
#> Positive: DMBT1, REG1A, LCN2, REG3A, DUOX2
#> Negative: TGFBI, KRT23, AXIN2, ASCL2, PRSS23Find neighbour cells (in PCA space, not real space)
cropped.obj <- FindNeighbors(cropped.obj, dims = 1:30)Run with default cluster params
cropped.obj <- FindClusters(cropped.obj)
#> Modularity Optimizer version 1.3.0 by Ludo Waltman and Nees Jan van Eck
#>
#> Number of nodes: 16537
#> Number of edges: 589164
#>
#> Running Louvain algorithm...
#> Maximum modularity in 10 random starts: 0.8101
#> Number of communities: 13
#> Elapsed time: 6 seconds
Run UMAP
cropped.obj <- RunUMAP(cropped.obj, dims = 1:30)Markers of each cluster
marks <- FindAllMarkers(cropped.obj)Visualise the UMAP