6 Example Analysis
6.1 SH-SY5Y Differentiation
SH-SY5Y is a commonly used neuroblastoma cell line. With appropriate treatment, it can be induced to differentiate into a ‘more neuronal’ form. Differentiated cells look quite different, growing thin neurites out from the body of the cell.
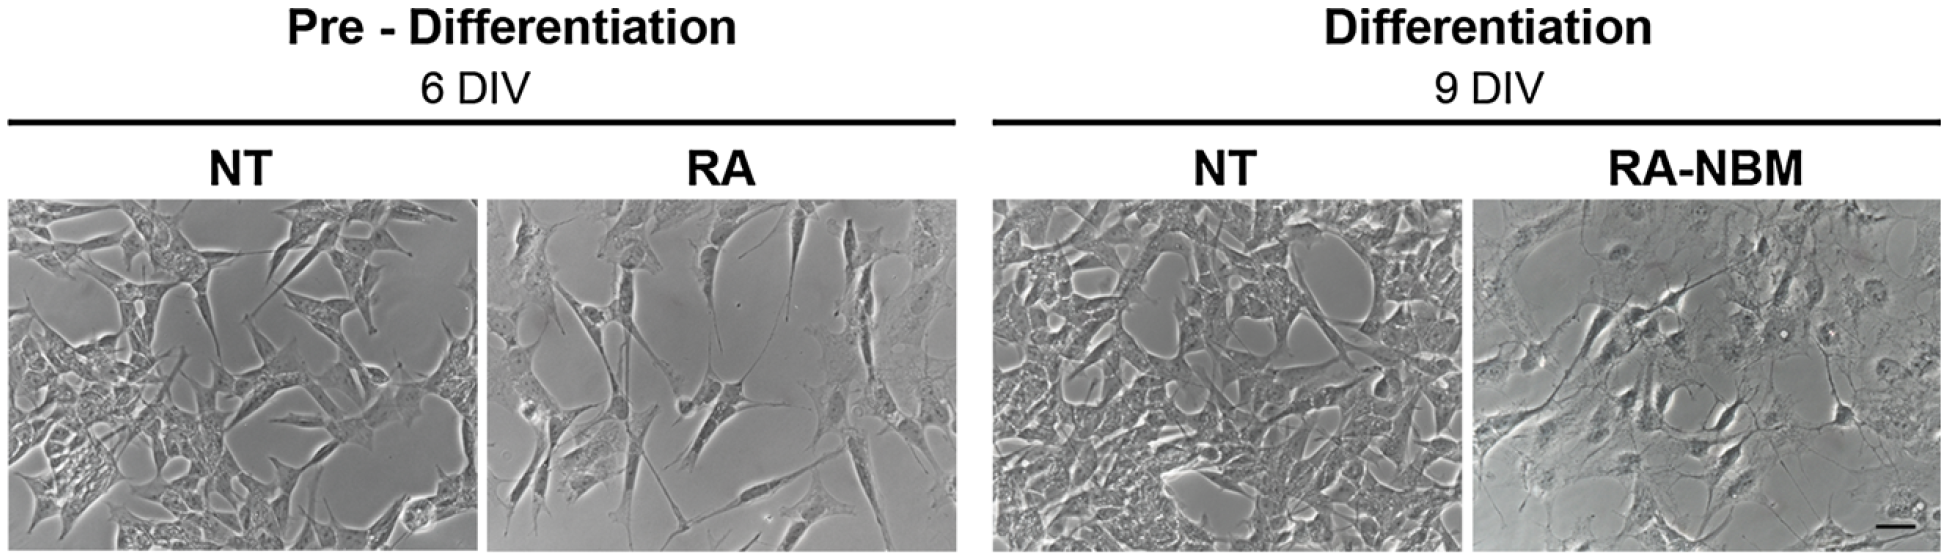
Figure 6.1: Morphological analysis of differentiated SH-SY5Y cells.
At 6-DIV stage, the cells exposed to RA showed an elongated morphology as compared to basal medium (NT). Cells subsequently treated in NBM for 3 days became more polarised, exhibited several neurites and branches and acquired a neuronal-like shape
Image is derived from Figure 4 (Pezzini et al. 2017).
6.2 The question: What pathways are involved in SH-SY5Y Differentiation?
In their paper Transcriptomic Profiling Discloses Molecular and Cellular Events Related to Neuronal Differentiation in SH-SY5Y Neuroblastoma Cells, Pezzini et al. induced neuronal differentiation of the SH-SY5Y neuroblastoma cell line and measured transcriptomic changes using RNA sequencing (Pezzini et al. 2017). During the 9-day differentiation protocol, SH-SY5Y cells were initially pre-differentiated in a retinoic acid (RA) medium for 6 days, followed by a 3-day treatment with a neurobasal medium (NBM) enriched with neurotrophic factors. Control cells, which were not treated (NT), were maintained under basal conditions and served as a comparison group. The authors then performed functional enrichment analysis on the differentially expressed genes.
6.3 The data : Differentially expressed genes
The example dataset for today is the RNAseq differential expression results.
They can be accessed via this Degust link:
This has been reanalysed from the published raw data, via the degust tool.
Note: Other tools and approaches may produce different-looking results, but generally, you will end up with a table of genes containing some measure of statistical confidence. The methods for functional enrichment analysis should remain similar.