14 gprofiler2
gprofiler2 is the R interface to the g:Profiler web-based toolset that you used in day 1 of the workshop.
Like the web interface, gprofiler2 performs ORA with g:GOSt against multiple databases simultaneously.
It supports all the same organisms, namespaces and data sources as the web tool. The list of organisms and corresponding data sources is available here (n = 984).
The full list of supported namespaces is available here.
The gprofiler2 user guide can be found here.
14.1 Input data
Since we are doing ORA, we will need a filtered gene list, and a background gene list. We will continue with the RNAseq dataset from Pezzini et al 2017 introduced yesterday.
14.2 Activity overview
- Load input dataset (a gene matrix with adjusted P values and log2 fold change values)
- Filter for differentially expressed genes (DEGs) and create a gene list R object
- Extract background genes and create a background gene list R object
- Run ORA with
gostfunction - Save the tabular results to a file
- Visualise the results with
gostplot - Run a
gostmulti-query for up-regulated and down-regulated genes - Compare
gprofiler2R results to theg:Profilerweb results
➤ Go back to your RStudio interface, where we have opened the gprofiler2.Rmd notebook and loaded the required R packages.
Instructions for the analysis will continue from the R notebook.
To finish up: The last task is to knit the notebook. Our notebook is editable, and can be changed. Deleting code deletes the output, so we could lose valuable details. If we knit the notebook to HTML, we have a permanent static copy of the work.
➤ Knit the notebook to HTML
On the editor pane toolbar, under Preview, select Knit to HTML.
If you have already run Preview, you will see Knit instead of Preview.
The HTML file will be saved in the same directory as the notebook, and with the same filename, but the .Rmd prefix will be replaced by .html. The knit HTML will typically open automatically once complete.
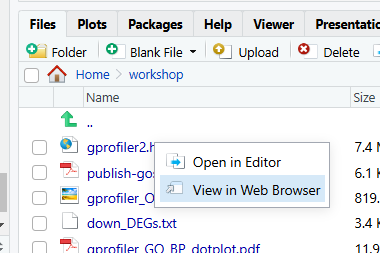
❗If you receive a popup blocker error, click cancel (not try again), and in the Files pane of RStudio, single click the gprofiler.html file and select View in Web Browser.

Note that the notebook will only successsfully knit if there are no errors in the code. You can ‘preview’ HTML with code errors.
✋ If your knit fails, please ask for assistance resolving the errors
14.3 End of activity summary
- We have extracted a gene list and background gene list from a DE dataset and run ORA with
gprofiler2gostfunction - We have plotted the data with
gostplotManhattan plots andggplot2dotplots - We have run a
gostmulti-query separating up and down regulated genes - We have verified that
gprofiler2results match the results fromg:Profilerweb - We have saved a rendered HTML document as a static record of our analysis including all code executed, parameters applied, as well as version information for R, RStudio, R packages and gProfiler database to ensure reproducibility