14 ATAC Batch Assessment
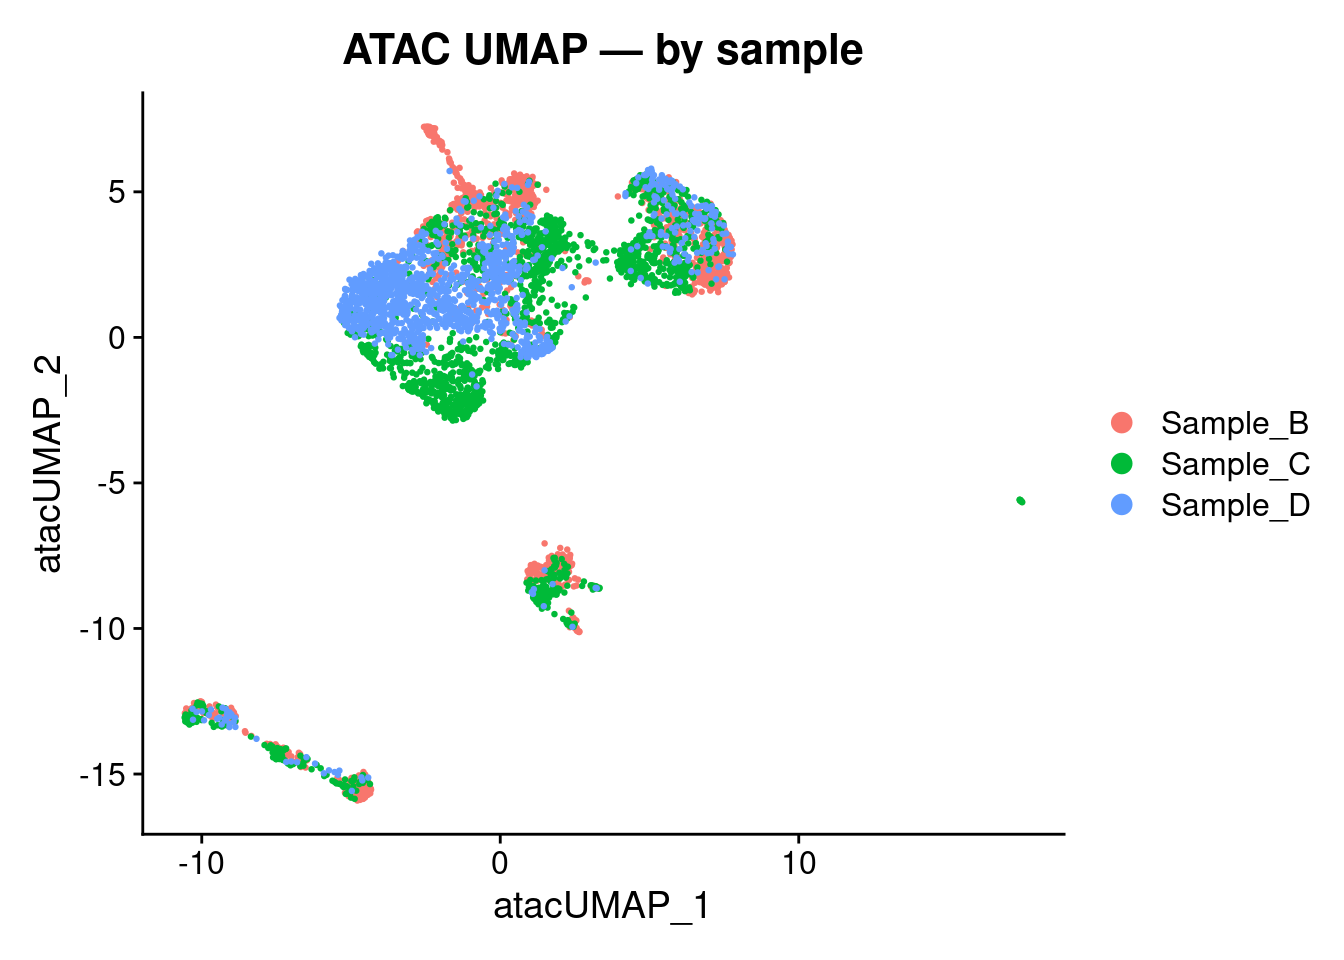
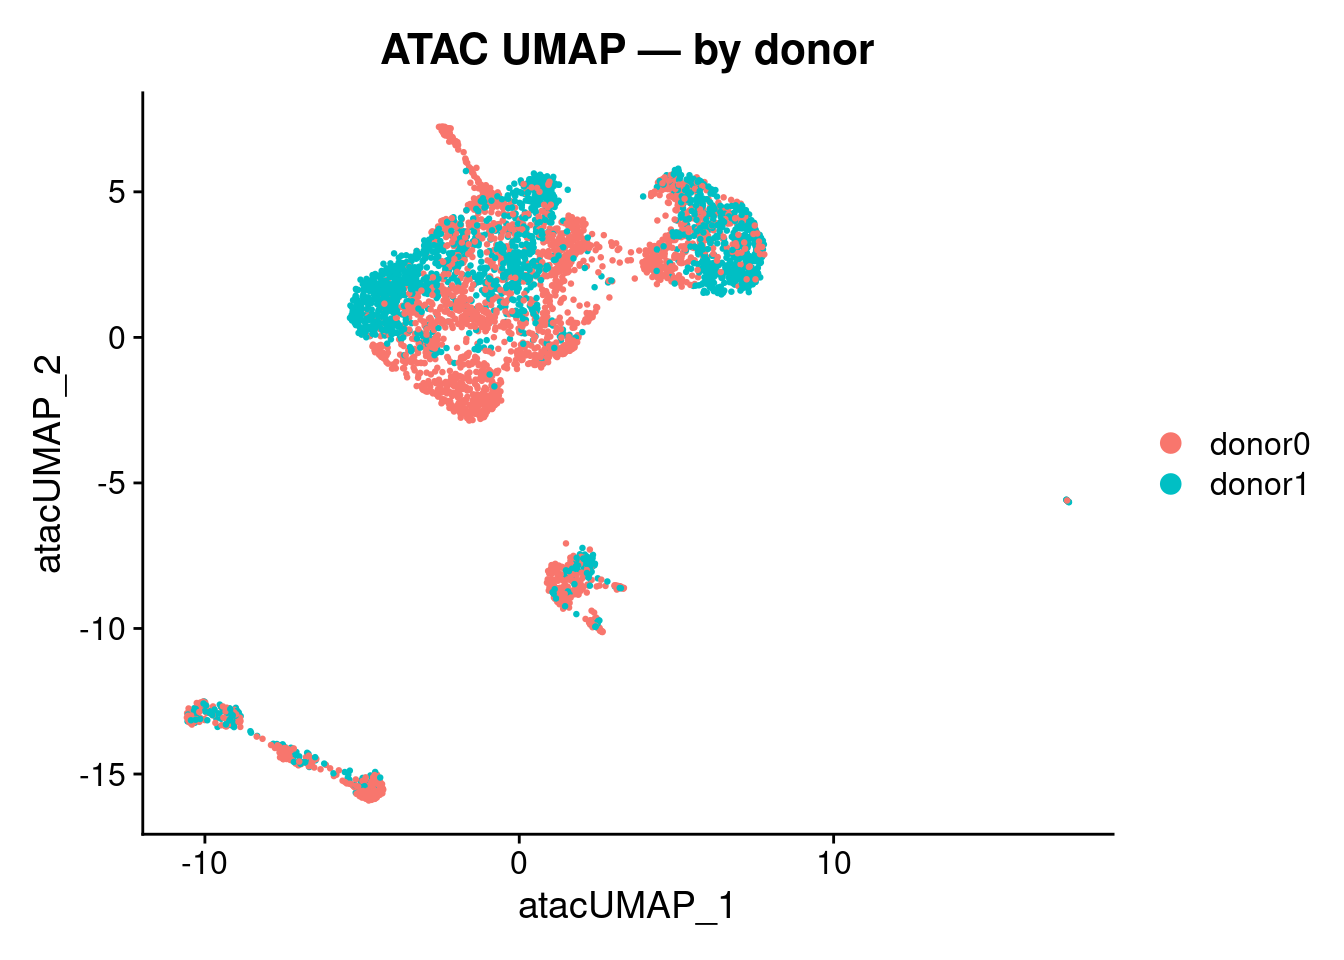
14.3 By sample and donor
DimPlot(combined, reduction = "umap.atac", group.by = "sample_donor") +
  ggtitle("ATAC UMAP — by sample-donor")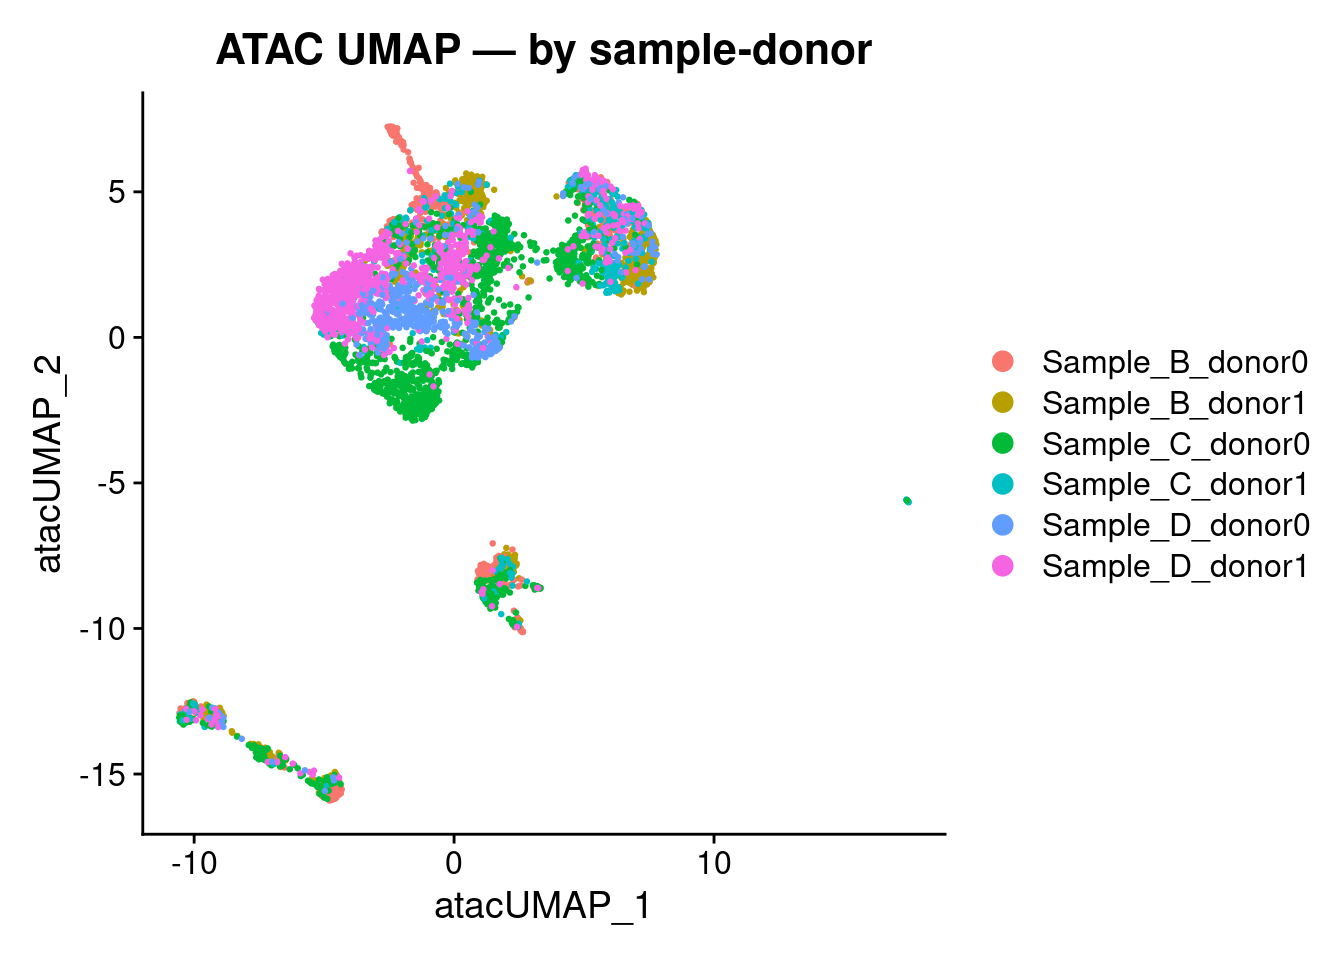
14.4 By condition
DimPlot(combined, reduction = "umap.atac", group.by = "individual_condition") +
  ggtitle("ATAC UMAP — by condition")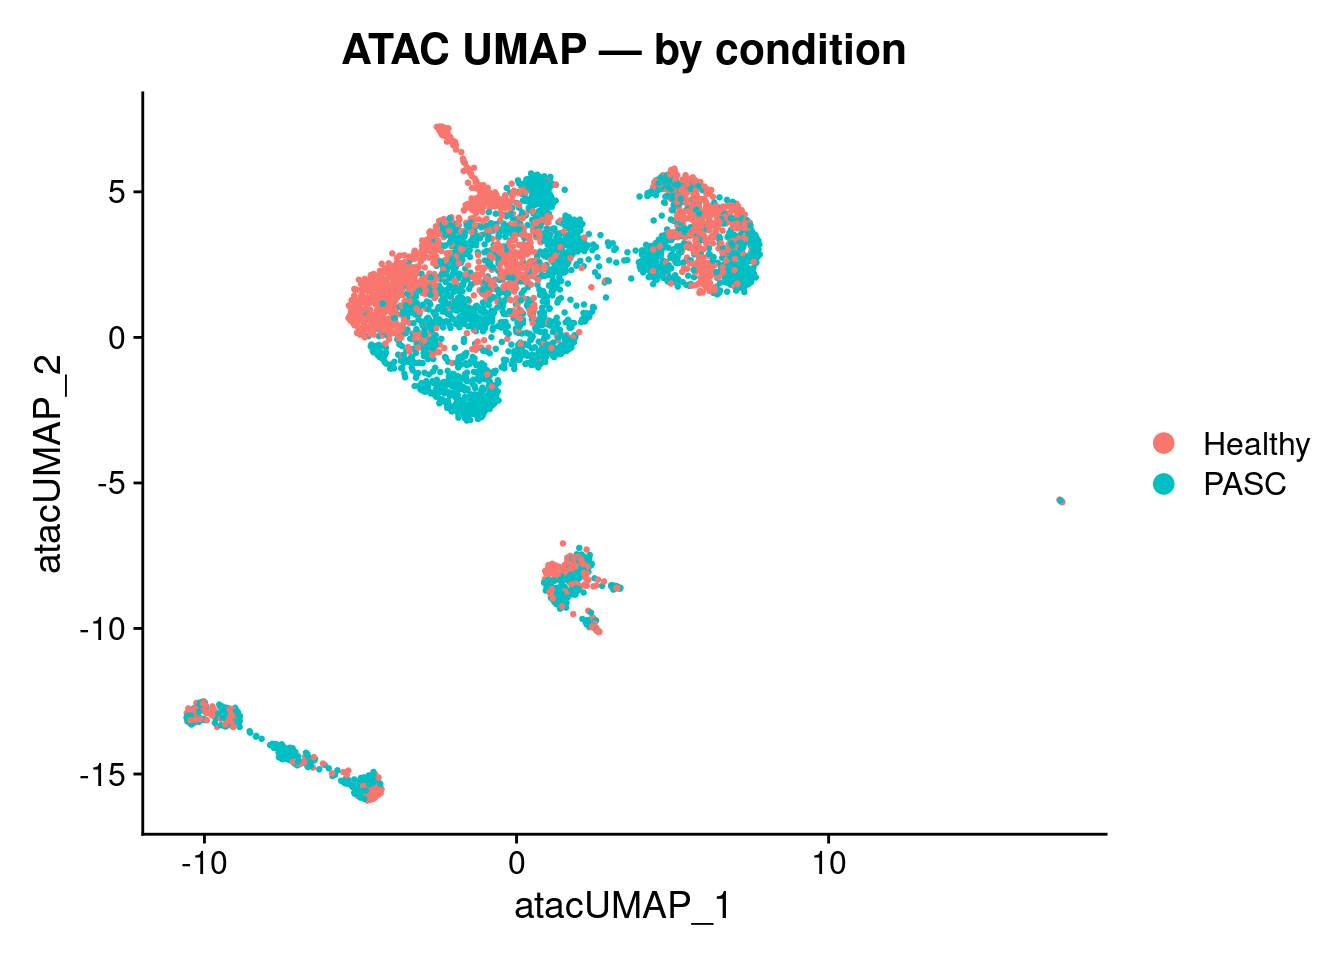
14.5 Split by sample
DimPlot(combined, reduction = "umap.atac",
        split.by = "sample", group.by = "sample_donor") +
  ggtitle("ATAC UMAP — split by sample")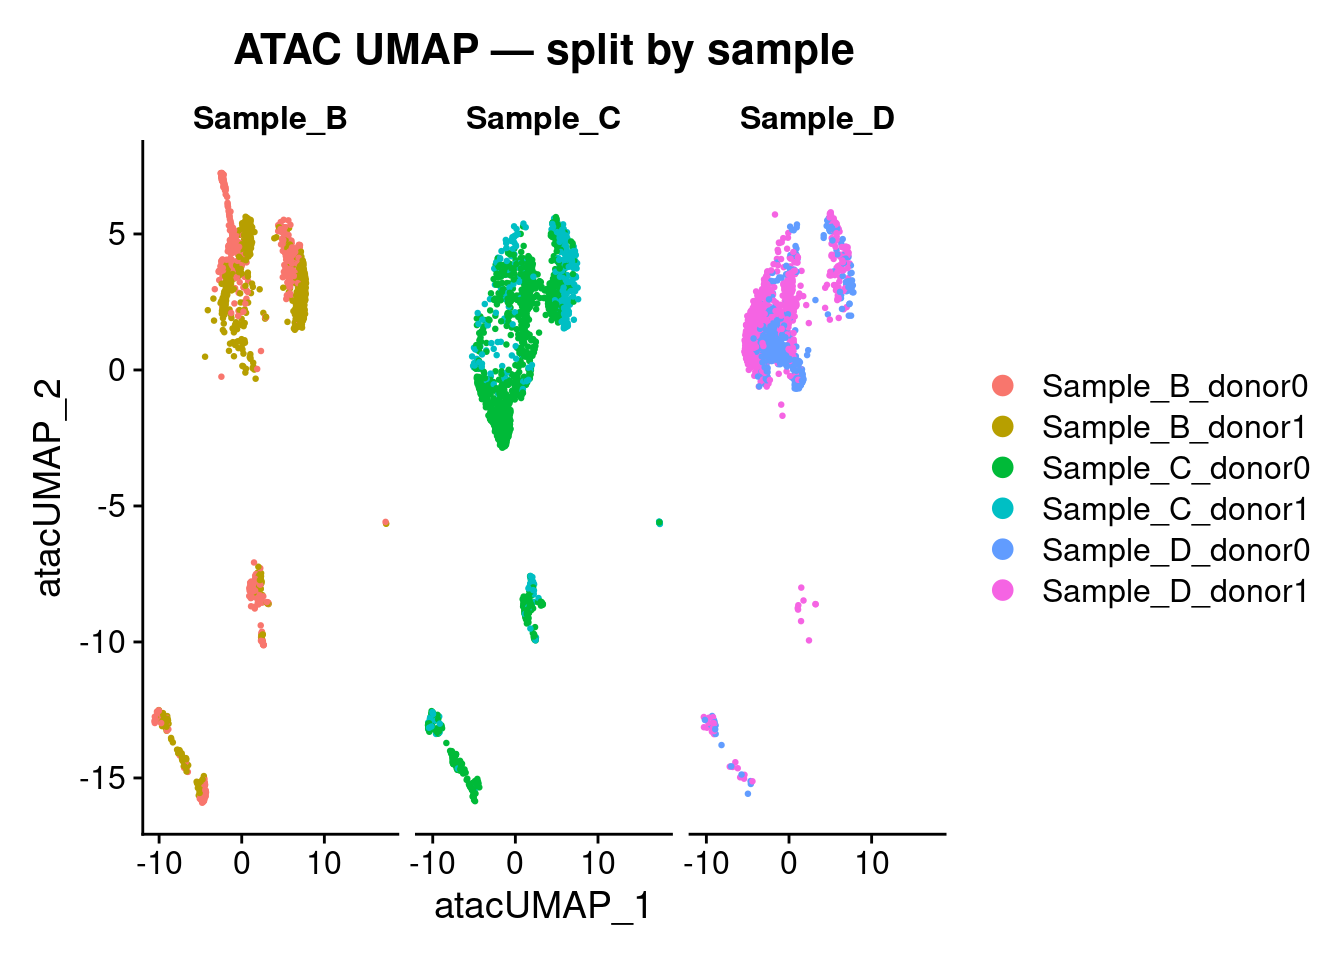
14.6 Summary
The plots above show strong separation by sample or sample_donor in
either modality, batch correction should be applied before building the WNN
graph:
RNA: addressed in the RNA Integration chapter via Seurat CCA (FindIntegrationAnchors / IntegrateData),
using cell-type marker genes derived from the Healthy subset as anchor features. This focuses
the alignment on cell-type-defining transcriptional programs rather than disease-associated expression
shifts.
ATAC: addressed in the ATAC Integration chapter via reciprocal LSI (FindIntegrationAnchors(reduction = "rlsi") / IntegrateEmbeddings),
using differentially accessible peaks derived from the Healthy subset as anchor features.
Harmony was evaluated but not adopted: the sample_donor grouping variable is confounded with
individual_condition, so Harmony correction risks removing genuine disease-associated chromatin
accessibility variation alongside technical batch effects.