17 Cross-modal Integration
17.1 WNN graph construction
The WNN graph is built using pca_integration (dims 1:15, integrated RNA)
and lsi_integration (dims 2:50, LSI, excluding the
depth-correlated first dimension). The resulting weighted nearest neighbour
graph is used to compute the joint UMAP (integration.wnn) and to cluster
cells across a resolution sweep.
# replace the assays with the corrected ones
combined[["pca_integration"]]<-rna_integration[["pca_integration"]]
combined[["lsi_integration"]]<-atac_integration[["lsi_integration"]]

n_lsi_atac <- ncol(Embeddings(combined, "lsi_integration"))
n_pca_rna  <-  ncol(Embeddings(combined, "pca_integration"))

combined <- FindMultiModalNeighbors(
  combined,
  reduction.list       = list("pca_integration", "lsi_integration"),
  dims.list            = list(1:15, 1:n_lsi_atac),
  modality.weight.name = c("RNA.weight", "ATAC.weight"),
  verbose              = TRUE
)

combined <- RunUMAP(combined,
                    nn.name        = "weighted.nn",
                    assay          = "RNA",
                    reduction.name = "integration.wnn",
                    reduction.key  = "WNN_")

resolution <- 2
combined   <- FindClusters(combined,
                           graph.name = "wsnn",
                           resolution = seq(0.1, resolution, 0.1))
17.2 WNN UMAP
DimPlot(combined, reduction = 'integration.wnn', group.by = "sample")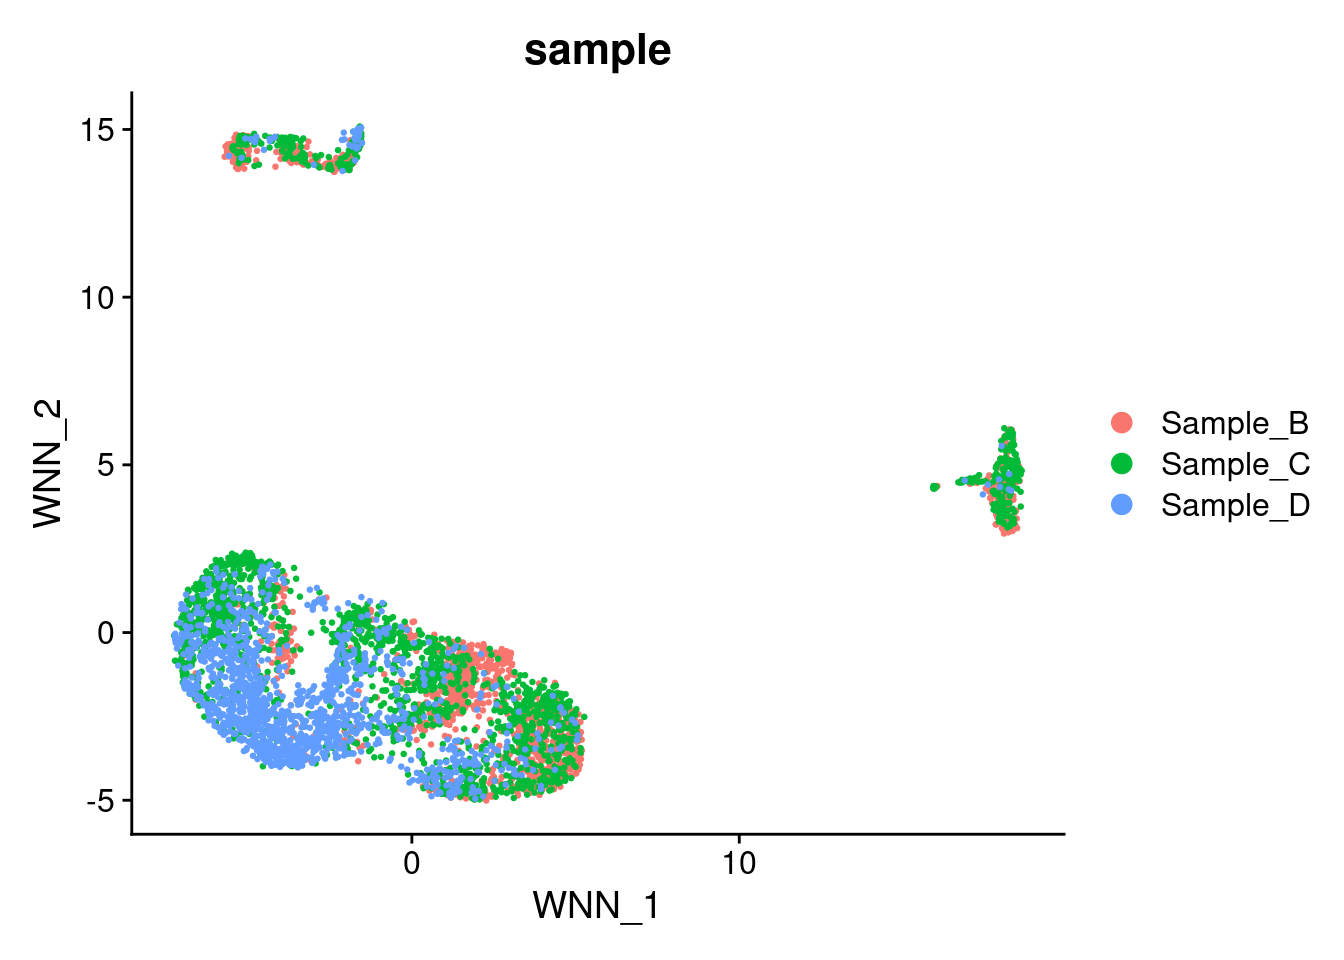
DimPlot(combined, reduction = 'integration.wnn', group.by = "sample_donor")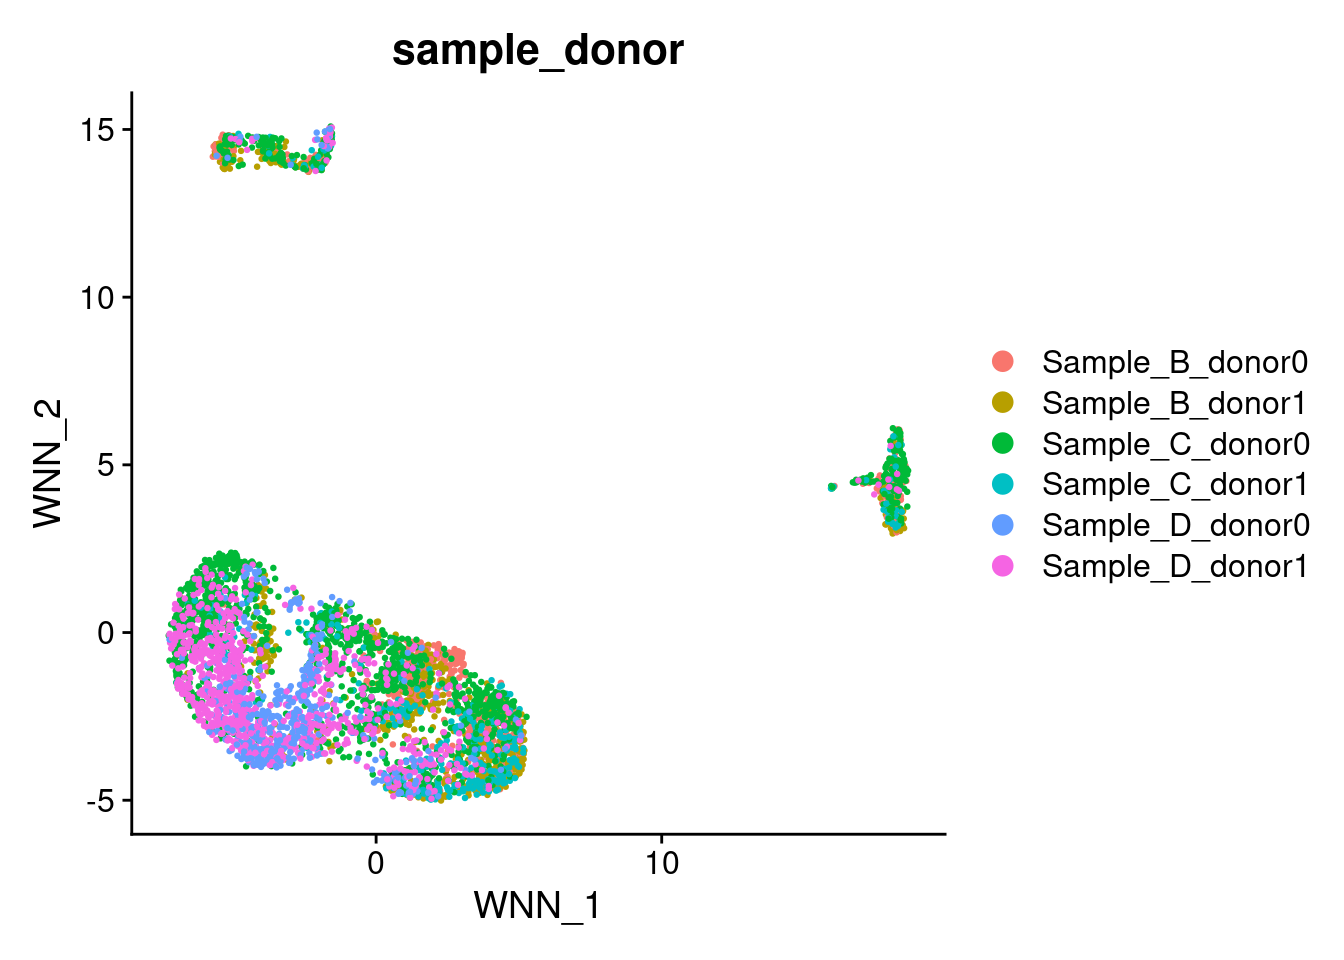
DimPlot(combined, reduction = 'integration.wnn', group.by = "individual_condition")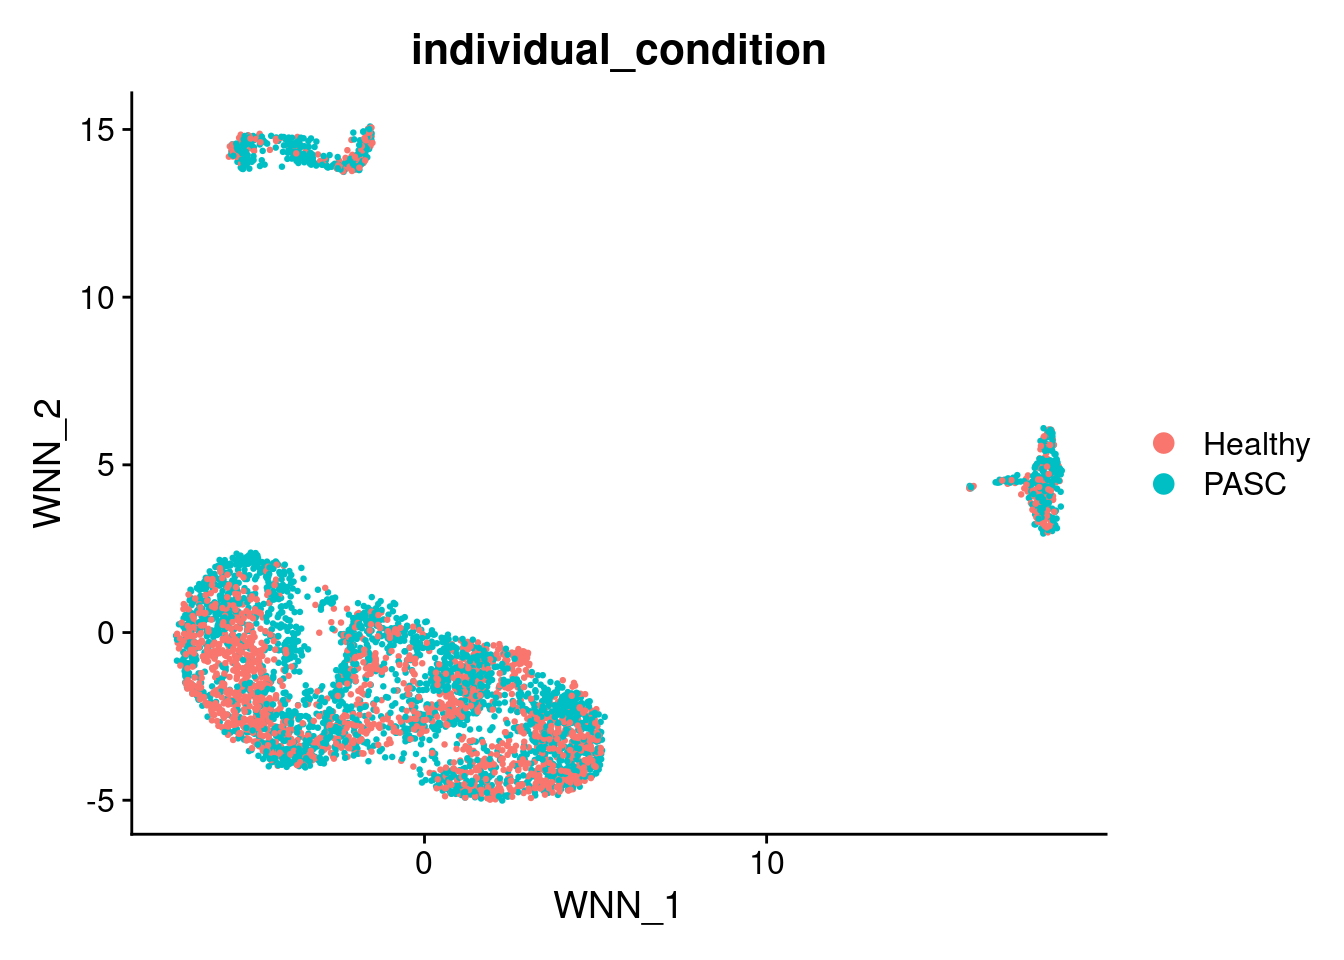
17.3 WNN UMAP — split by condition
DimPlot(combined,
        reduction = 'integration.wnn',
        split.by  = "individual_condition", ncol=1)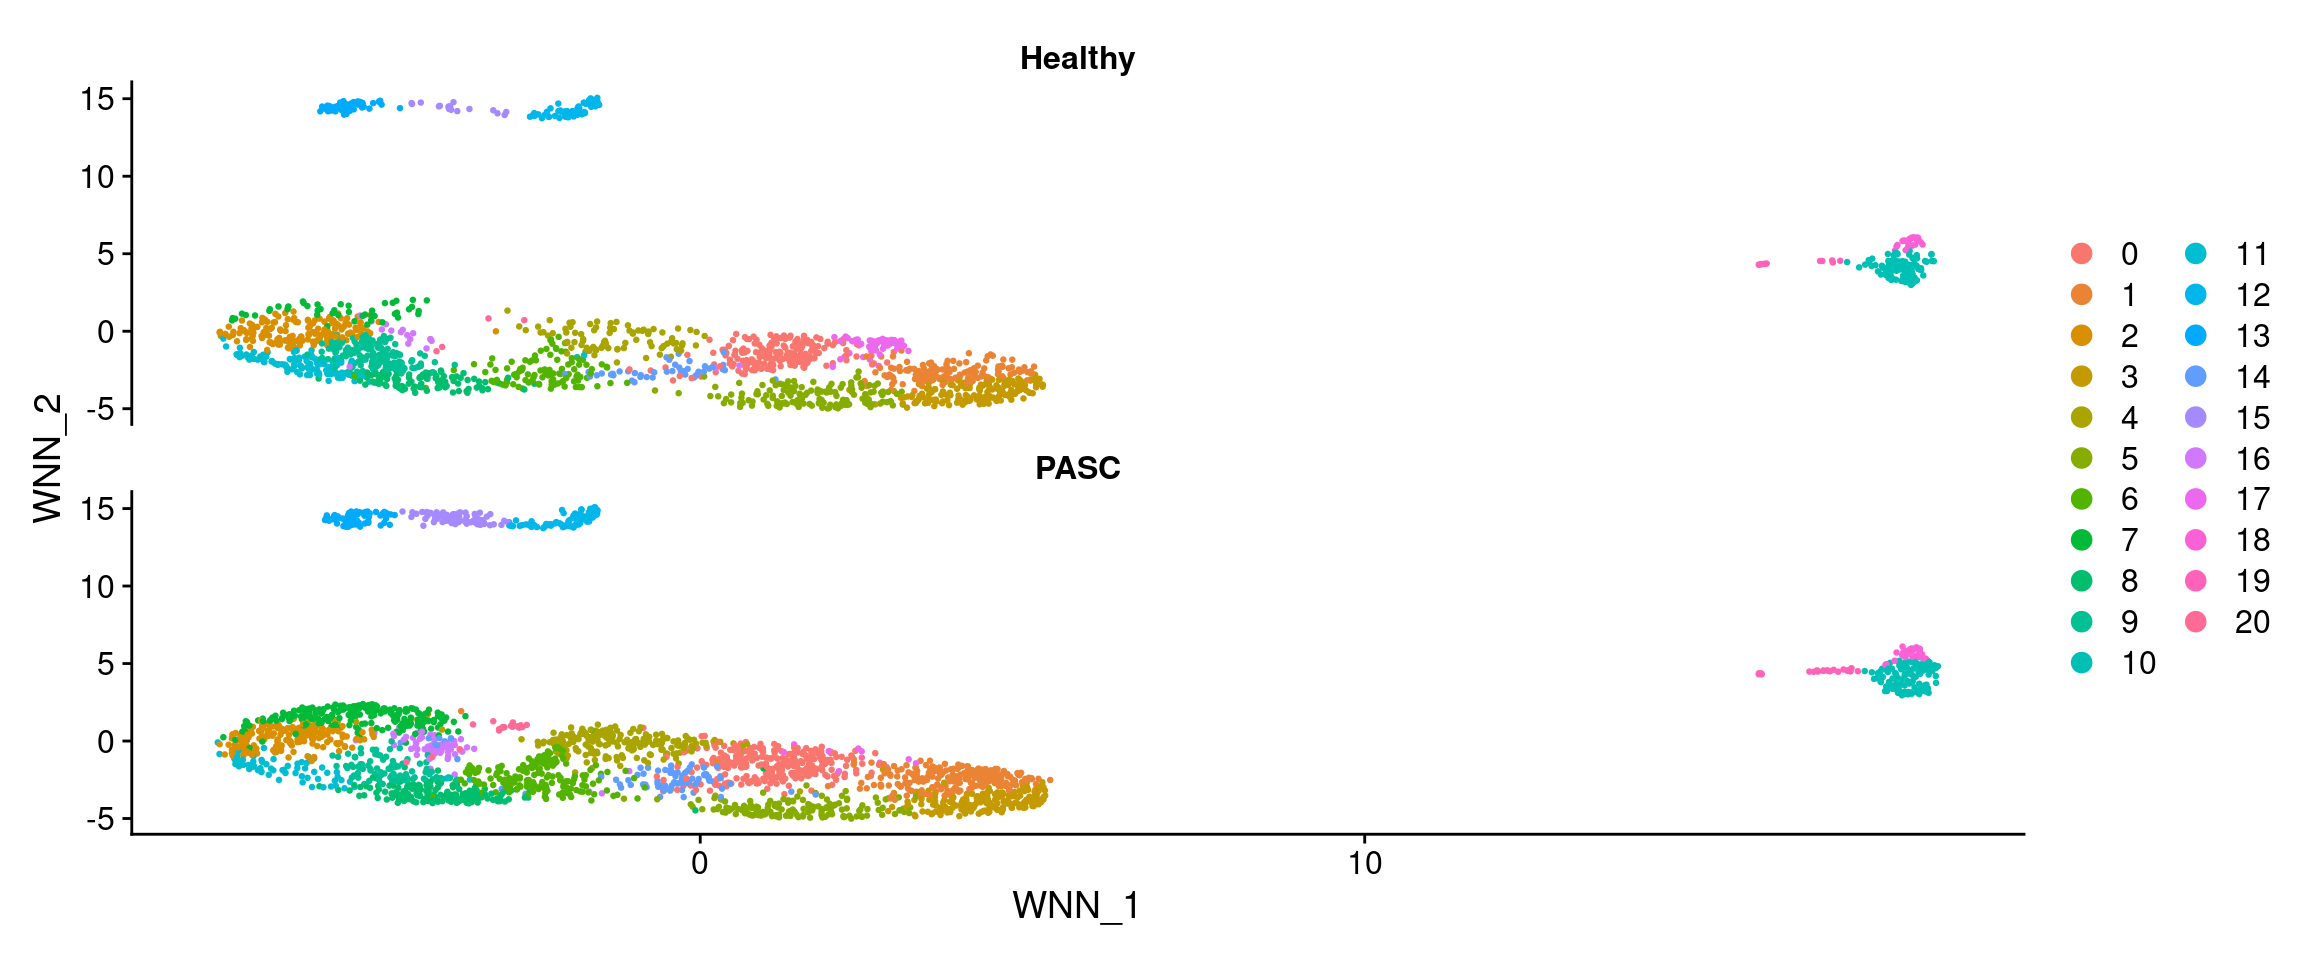
  DimPlot(combined,
        reduction = 'integration.wnn',
split.by = "sample_donor", ncol=1) 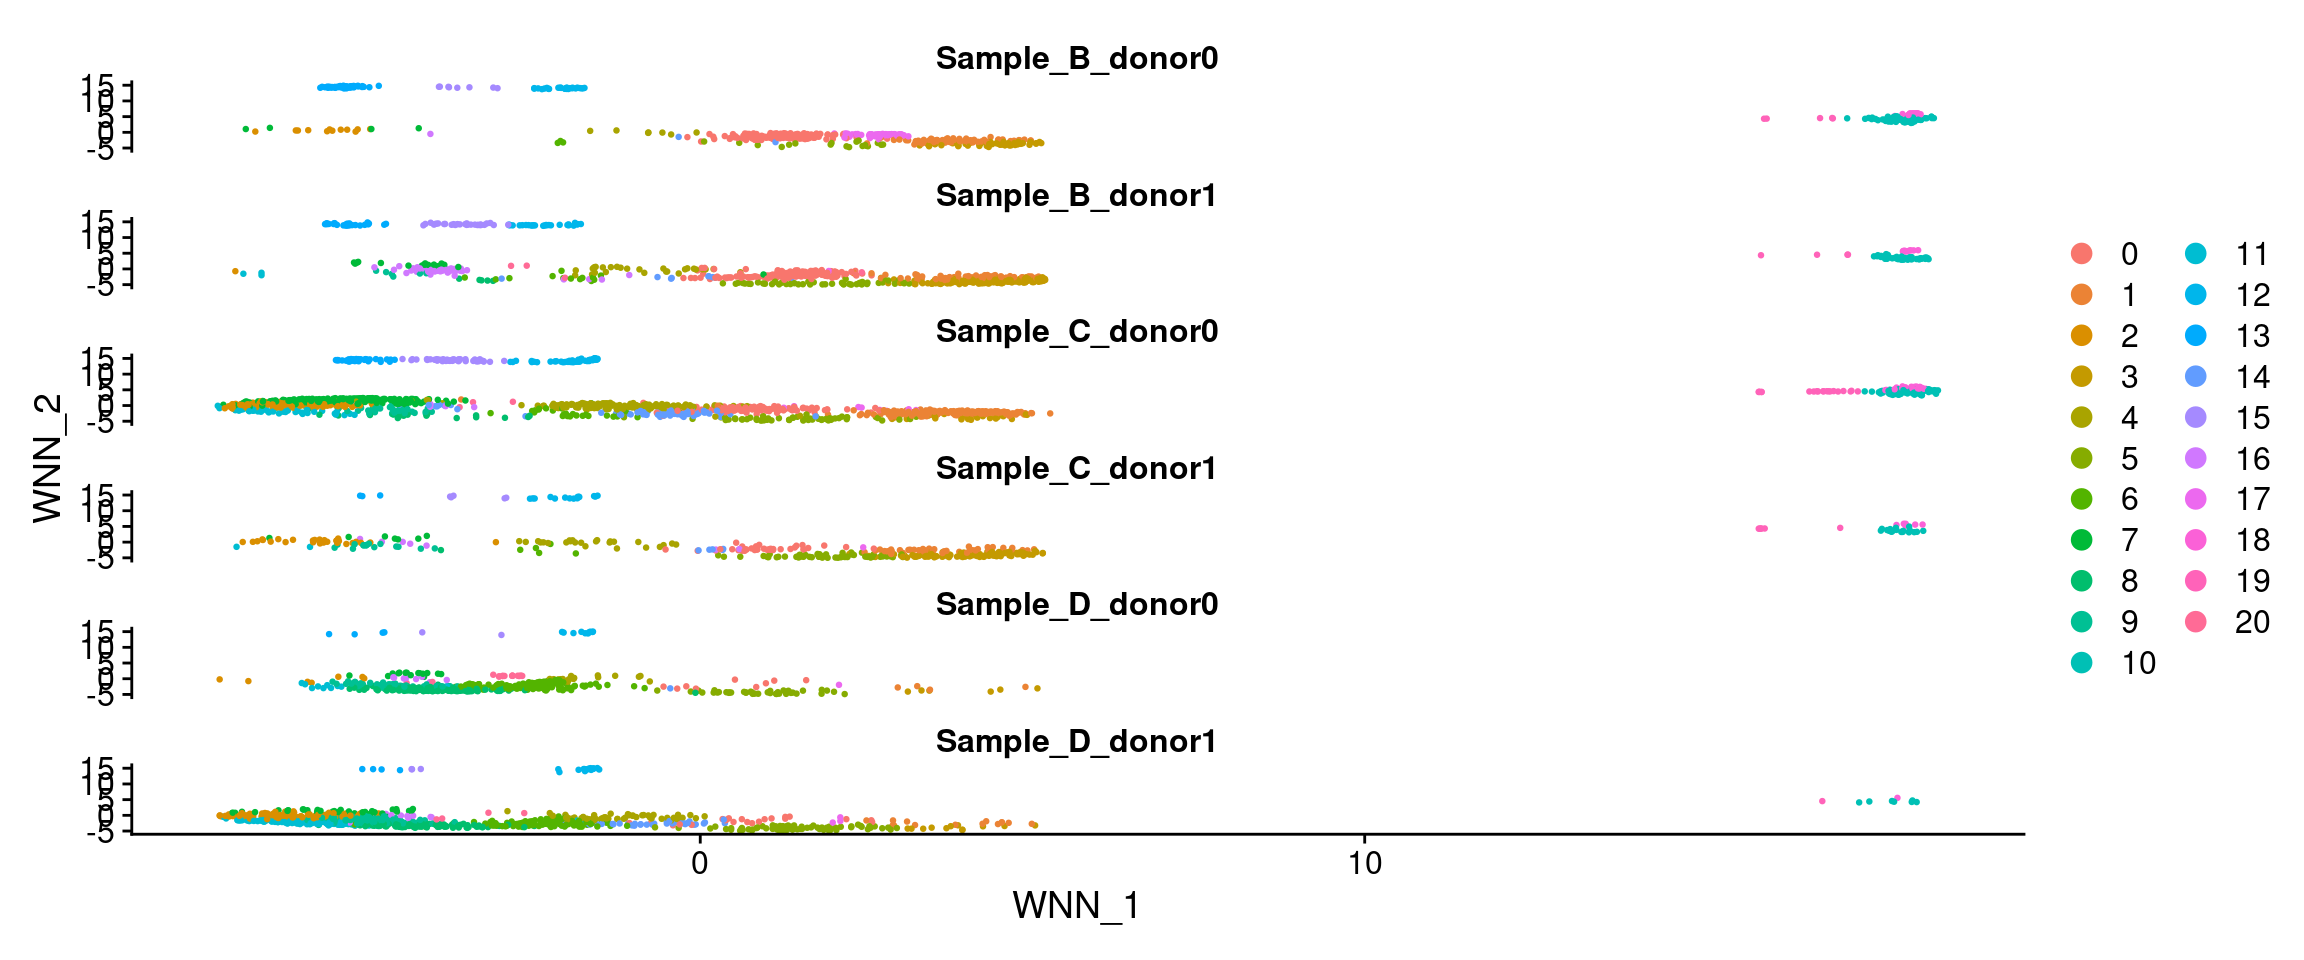
17.4 Modality weights
The RNA and ATAC weights per cell reflect how much each modality contributes to defining each cell’s neighbourhood. Cells where one modality dominates (weight close to 1) may have poor quality in the other modality. Modality weights are expected to be distributed evenly across samples within each cluster, reflecting balanced RNA and ATAC contributions to the WNN graph. Inspection of the ATAC weight distribution per cluster reveals that cluster 11 is an exception: Healthy cells in this cluster carry disproportionately high ATAC weights, driven by Sample_C_donor0 rather than reflecting a genuine biological signal. Because this imbalance is isolated to cluster 11 and is not observed across other clusters, it is interpreted as a technical artefact arising from inflated variance in the integrated_lsi embedding for that sample. To correct for this, the integrated_lsi embedding was rescaled so that its total variance matches that of pca_integration before WNN graph construction. This brings ATAC weights in cluster 11 in line with the rest of the dataset without affecting the relative structure of the embedding.
DefaultAssay(combined) <- "RNA"

FeaturePlot(combined, features = "RNA.weight",
            reduction  = "integration.wnn",
            min.cutoff = 0.2,
            max.cutoff = 0.8) +
  ggtitle("RNA weight") +
  scale_colour_gradient(low = "lightgrey", high = "darkblue",
                        limits = c(0.2, 0.8))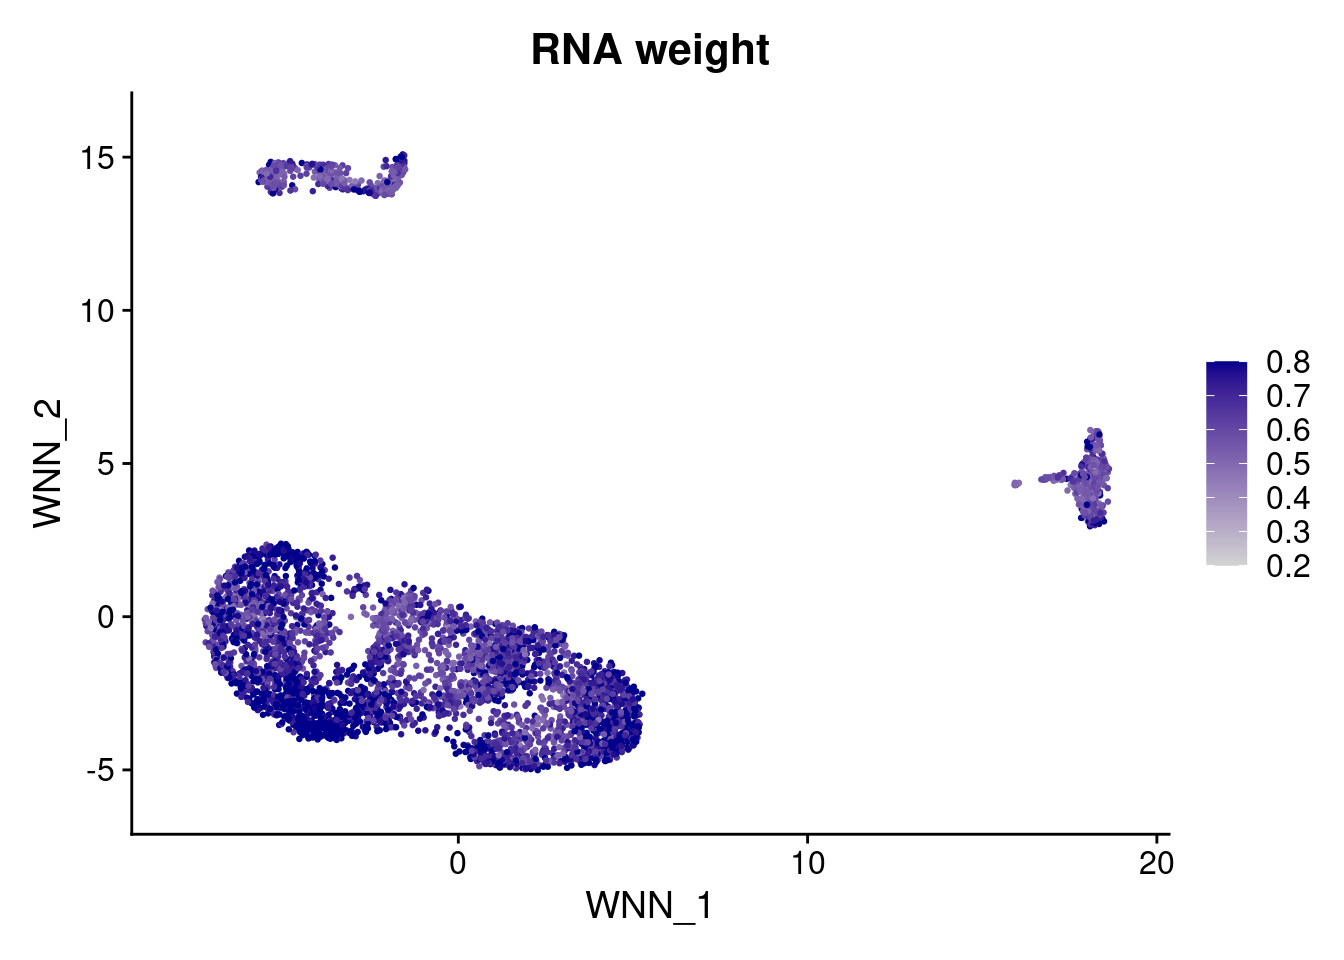
FeaturePlot(combined, features = "ATAC.weight",
            reduction  = "integration.wnn",
            min.cutoff = 0.2,
            max.cutoff = 0.8) +
  ggtitle("ATAC weight") +
  scale_colour_gradient(low = "lightgrey", high = "darkblue",
                        limits = c(0.2, 0.8))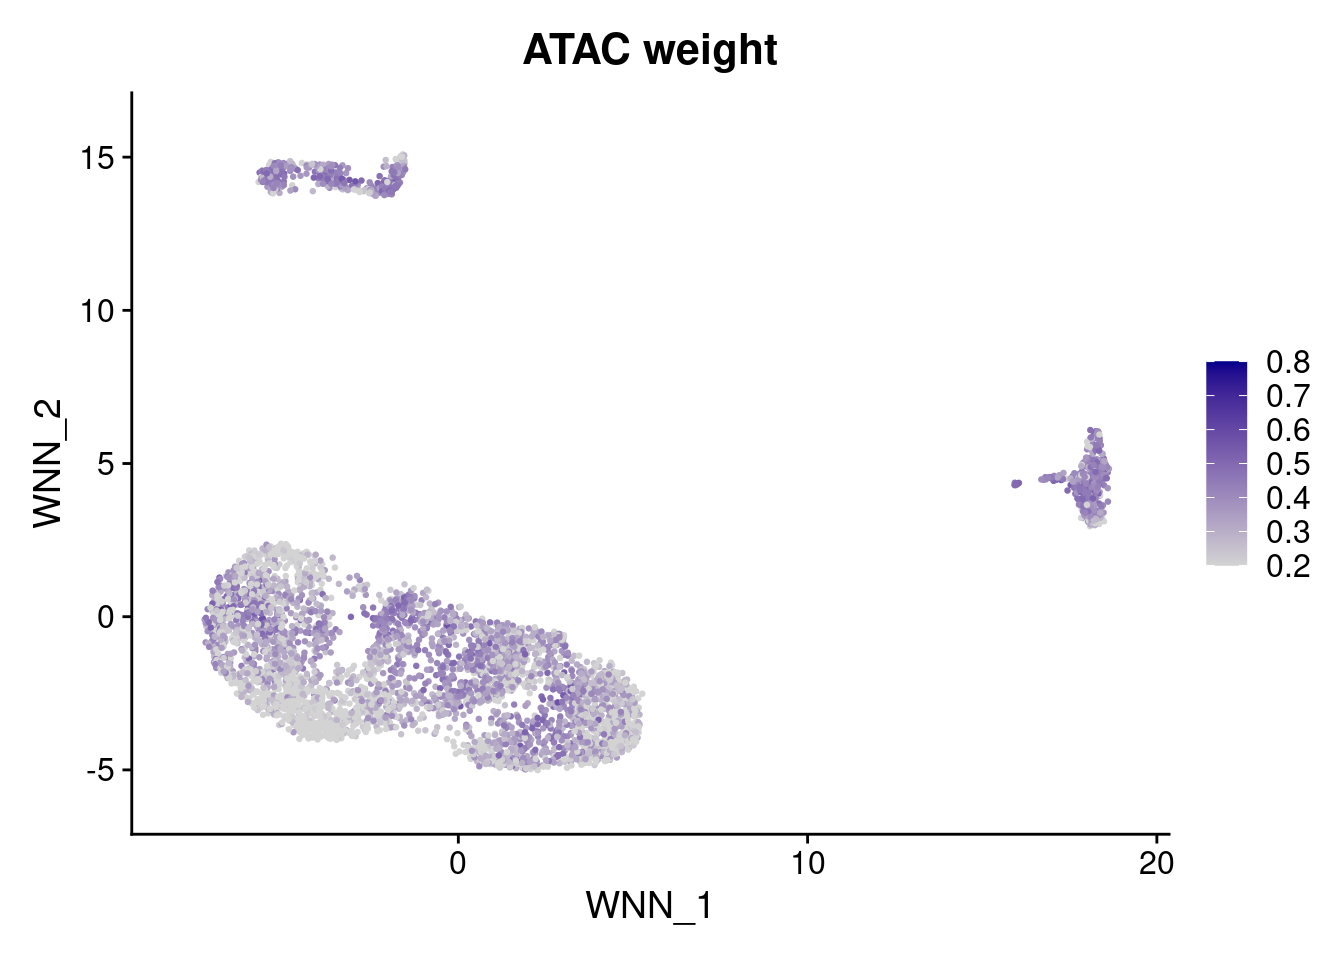
VlnPlot(combined, features = "RNA.weight", group.by = "wsnn_res.0.5", split.by = "individual_condition", pt.size = 0) 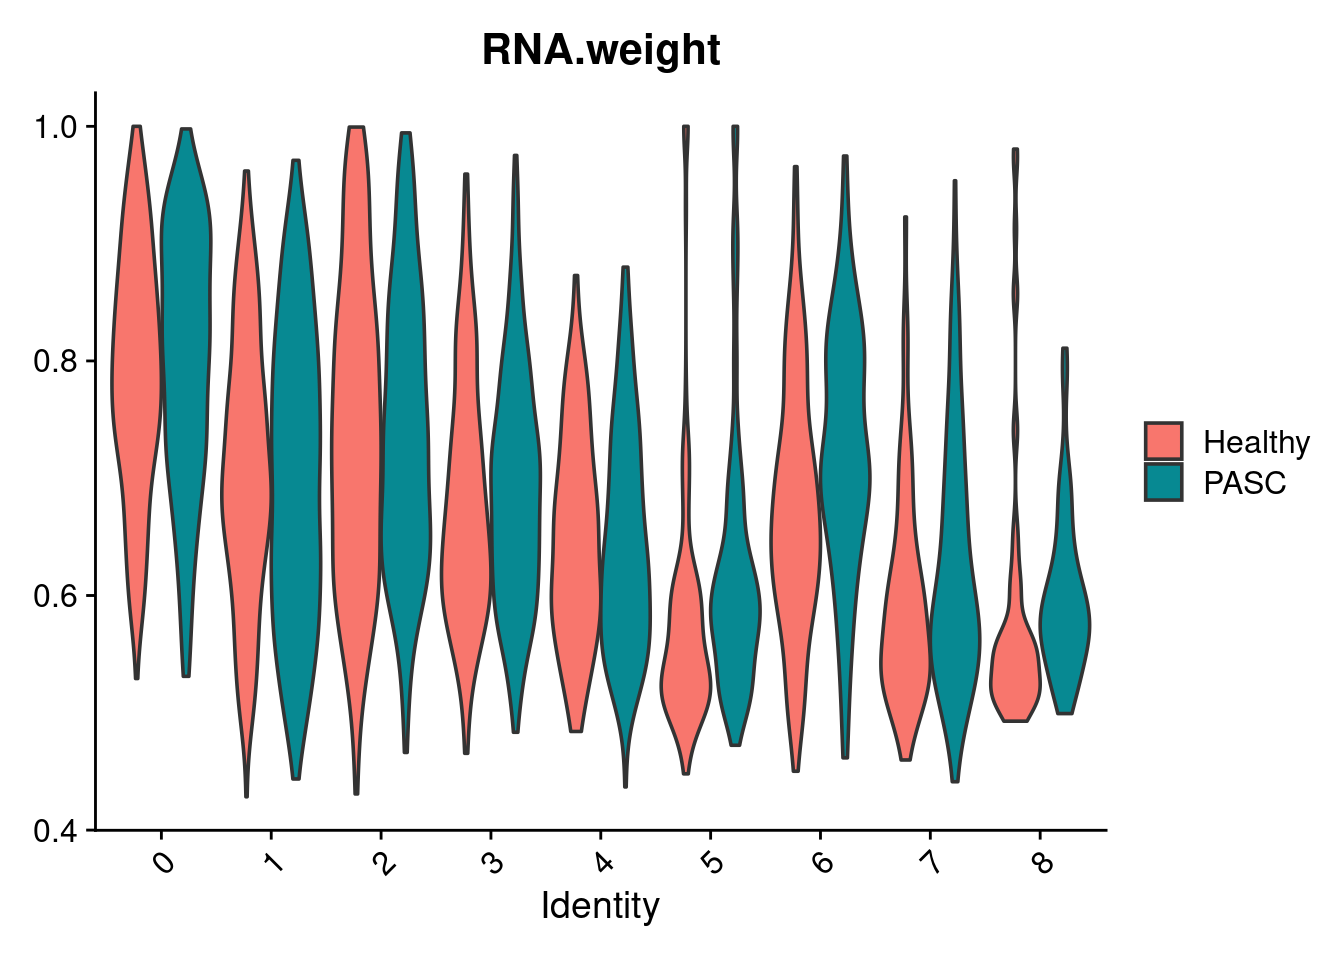
VlnPlot(combined, features = "ATAC.weight", group.by = "wsnn_res.0.5", split.by = "individual_condition", pt.size = 0) 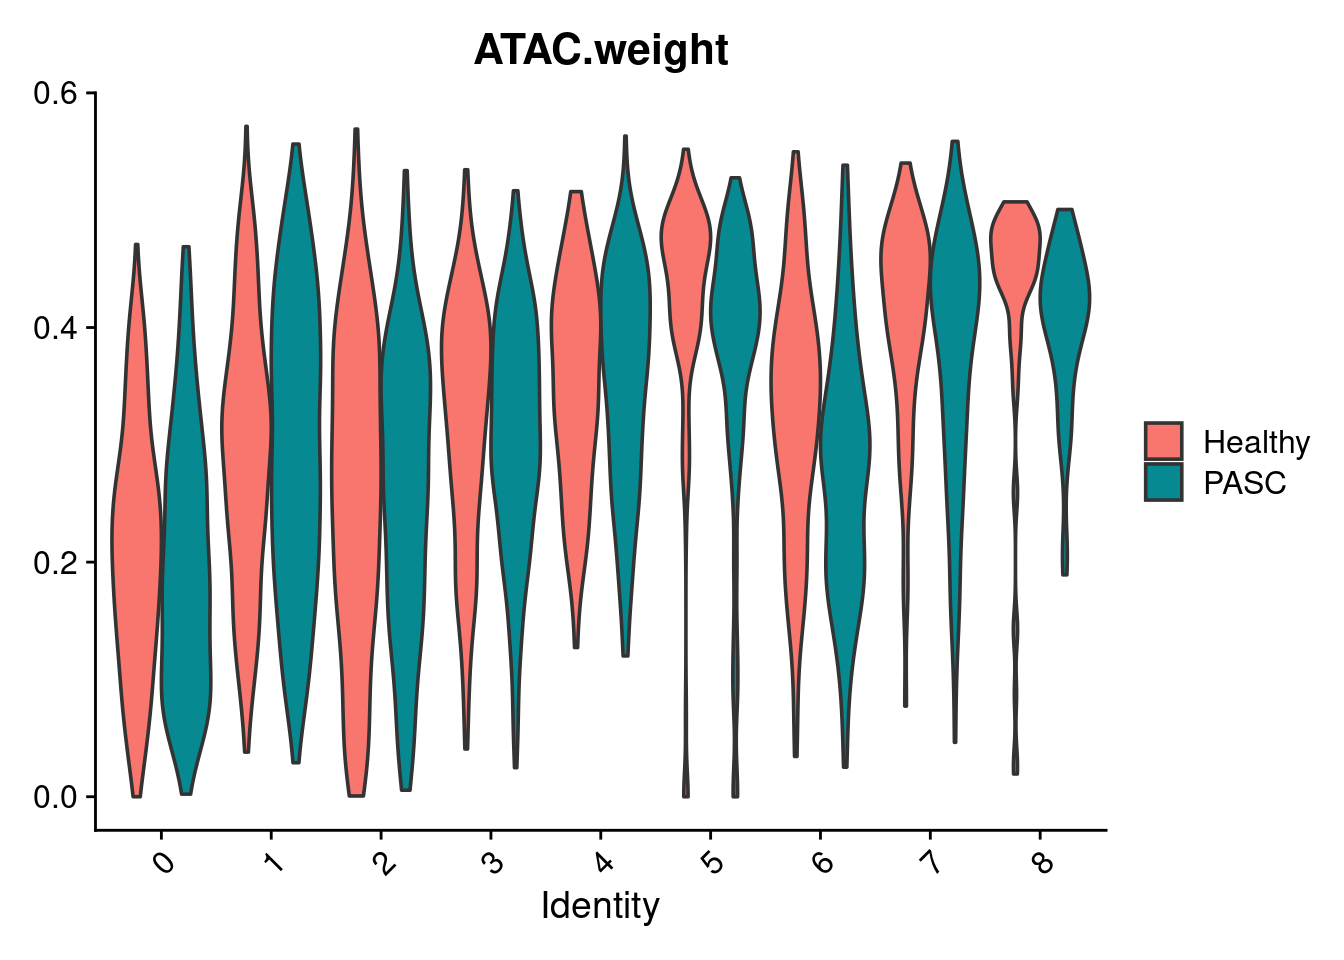
17.5 Clustree — WNN resolution sweep
clustree(combined, prefix = 'wsnn_res.', show_axis = TRUE) +
  theme(legend.key.size = unit(0.20, 'cm'))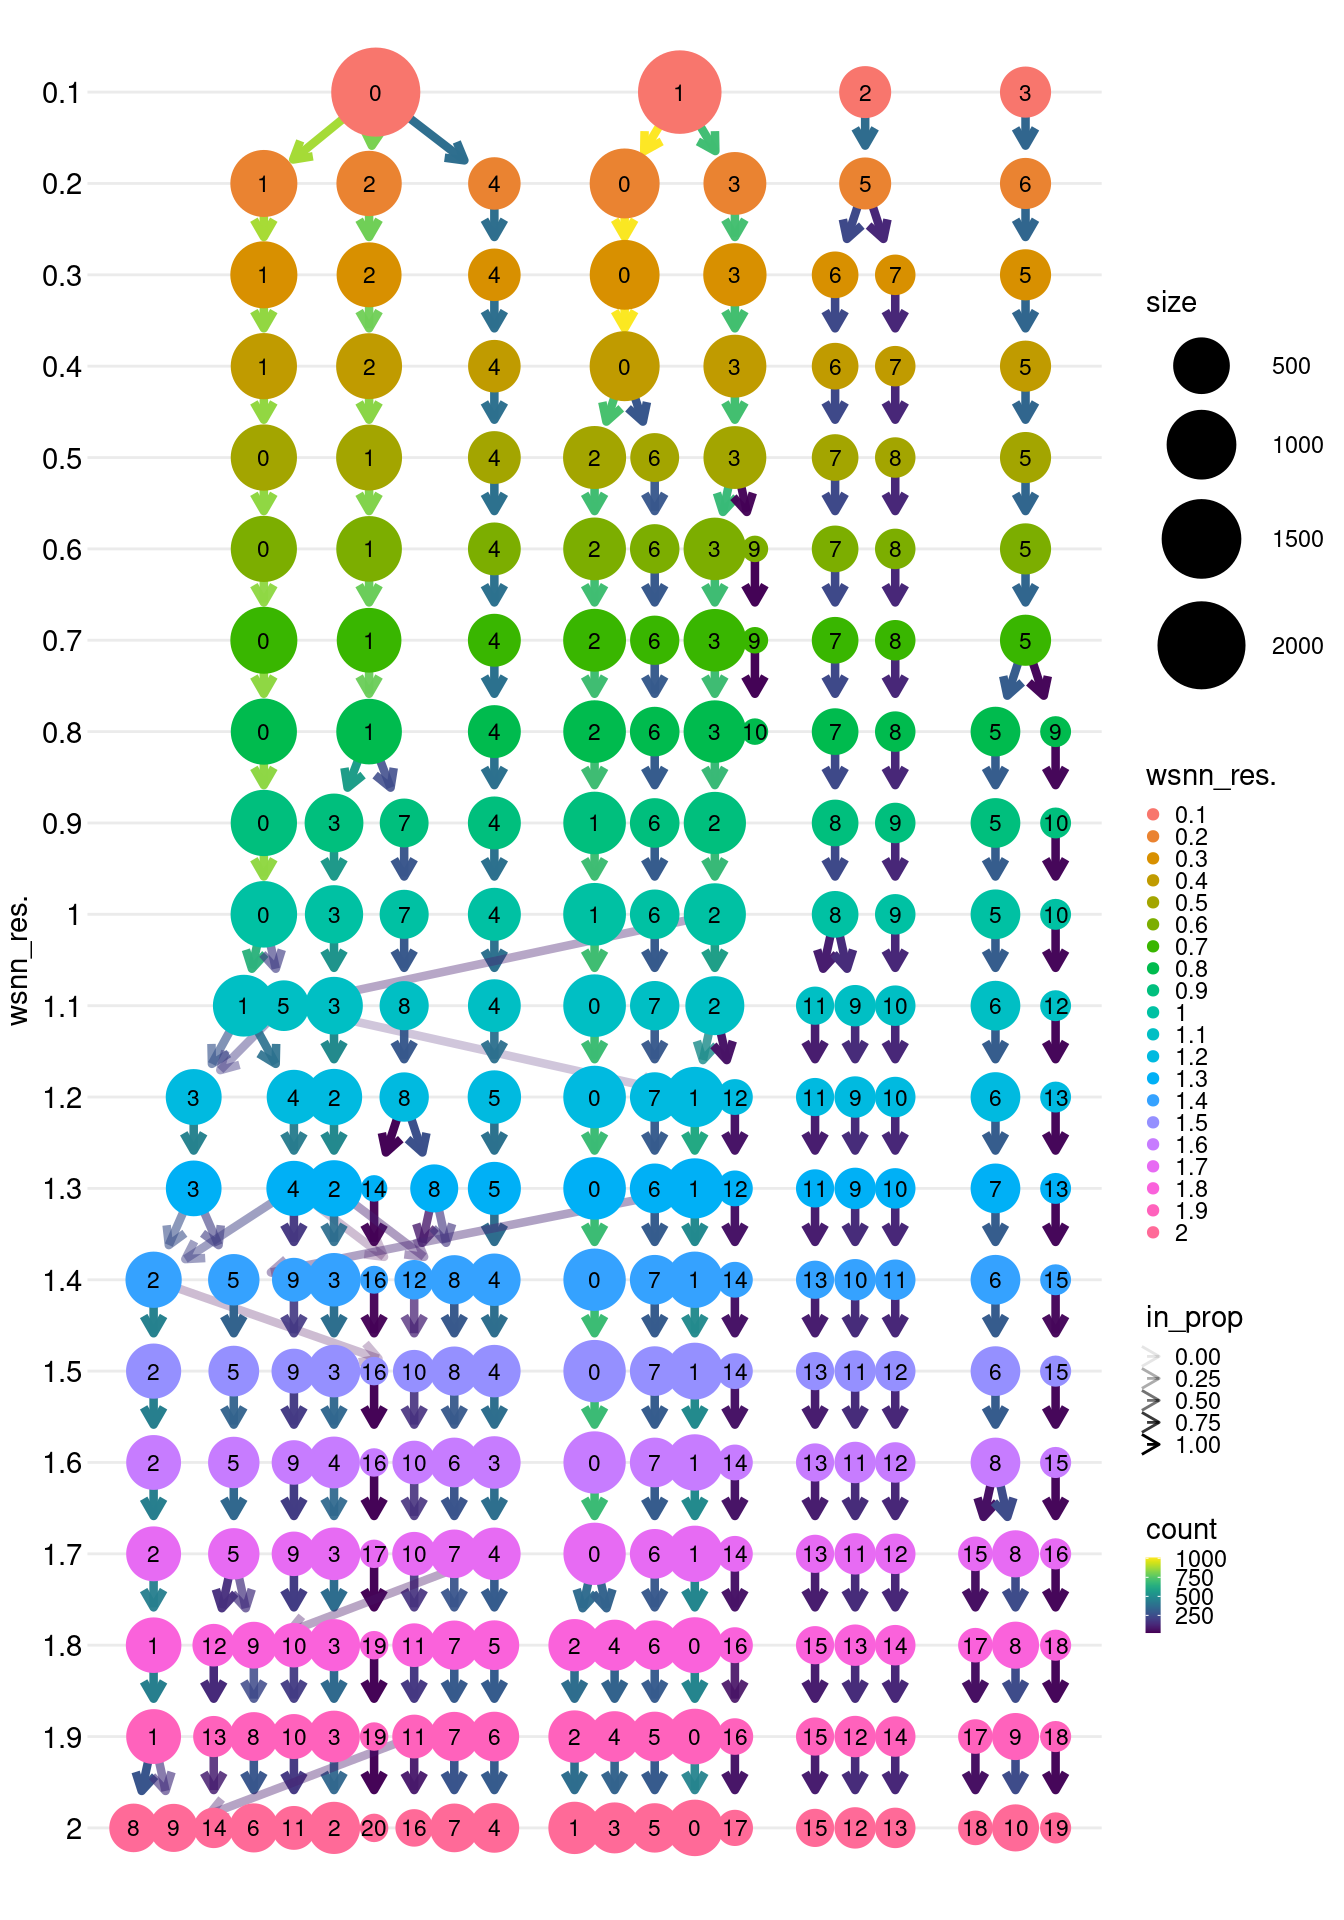
SaveSeuratRds(combined, "data/seurat_object_cross_modal_integration.rds")