25 TF-Motif Marker Integration
This chapter combines three independent lines of evidence to identify candidate driver TFs per cluster: (1) RNA marker genes restricted to known TFs, (2) chromVAR motif activity enrichment for the same clusters (chromVAR TF Activity chapter), and (3) the cluster’s overall marker gene set from the ROC-based marker table. A TF is only retained as a candidate driver for a cluster if it is both a differentially expressed TF gene and its motif is enriched in the same cluster’s accessible chromatin — convergent RNA and ATAC evidence is stronger support for a regulatory role than either modality alone.
25.1 Load object and prior results
library(Seurat)
library(presto)
library(dplyr)
library(arrow)
library(ggplot2)
library(patchwork)

combined <- LoadSeuratRds("data/seurat_object_cross_modal_integration_peakslinks_motifs_grn_regulons.rds")

tf_motifs_ct <- readRDS("data/tf_motifs_ct.rds")

markers_genes_list_roc <- open_dataset("data/markers_genes_list_wsnn_all_resolutions.parquet")


res0.8_RNA_marker_list_roc <- markers_genes_list_roc %>%
   dplyr::filter(annotation == "wsnn_res.0.5") %>% collect()

candidate_markers_ct  <- markers_genes_list_roc %>%
   dplyr::filter(annotation == "wsnn_res.0.5") %>%  dplyr::filter(auc > 0.5) %>%
  collect()

tfs <- read.table("~/data/tasks/liam.kealy/processing/Homo_sapiens_TF", sep = "\t", header = TRUE)
25.2 ROC-based integration
The ROC-based marker table stores log2FC (base-2 fold change), so the
fold-change filter is applied on the log2 scale to match.
DE_ct <- res0.8_RNA_marker_list_roc
DE_ct$group <- paste0("cluster_", DE_ct$group)


marker_tfs_ct <- DE_ct %>%
   dplyr::filter(feature %in% tfs$Symbol &
         abs(logFC) > log2(1.2) &
         auc > 0.70) %>%
  inner_join(tf_motifs_ct,
             by = c("feature" = "symbol"),
             suffix = c("_tf", "_motif"), relationship = "many-to-many") %>%
   dplyr::filter(group_tf == group_motif)

top_tfs_ct <- group_by(marker_tfs_ct, group_tf) %>%
  top_n(5, wt = auc_tf)

write.table(marker_tfs_ct, "data/marker_tfs_ct_ROC.txt")
25.3 Visualise candidate driver TFs
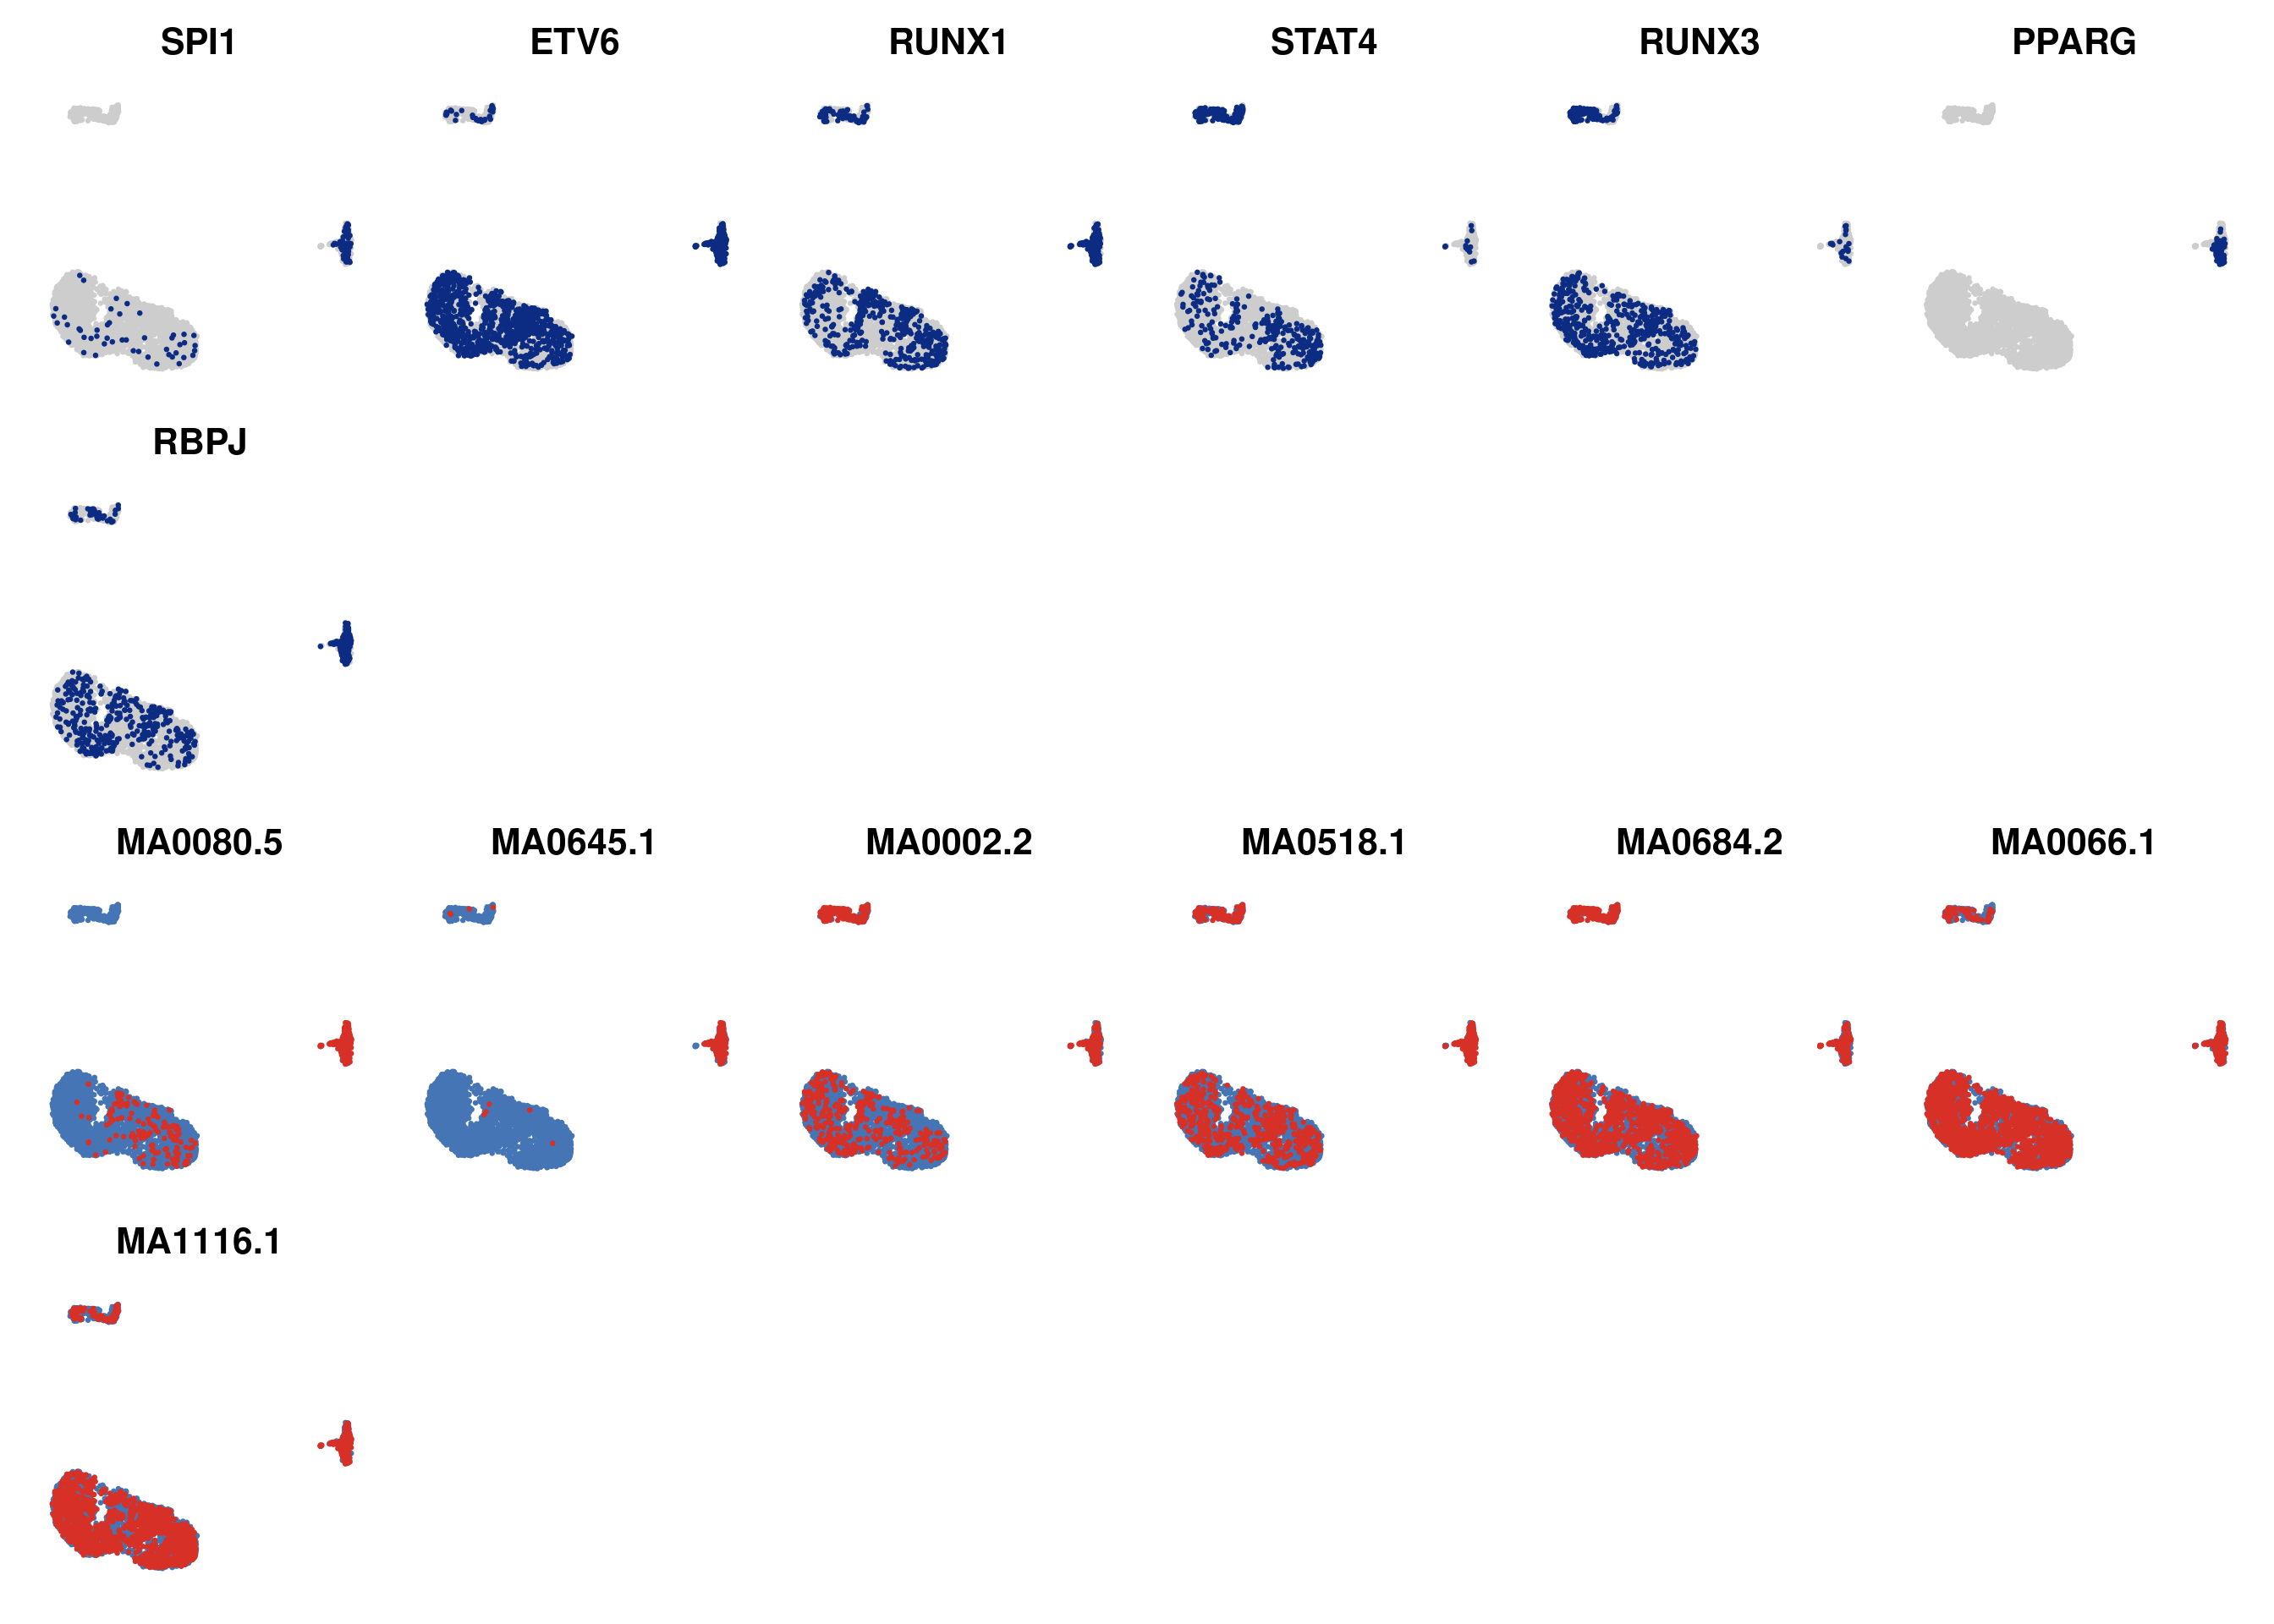
RNA expression of the top candidate TFs is shown alongside their chromVAR motif activity for the same clusters, on the WNN embedding.
beach_colscheme <- colorRampPalette(c("#cdcdcd", "#edf8b1", "#7fcdbb", "#41b6c4",
                                      "#1d91c0", "#225ea8", "#0c2c84"))
bluered_colscheme <- colorRampPalette(rev(c("#d73027", "#f46d43", "#fdae61", "#fee090",
                                            "#e0f3f8", "#abd9e9", "#74add1", "#4575b4")))

DefaultAssay(combined) <- "RNA"
p1 <- FeaturePlot(combined,
                  features = top_tfs_ct$feature,
                  reduction = "integration.wnn",
                  order = TRUE,
                  cols = beach_colscheme(30),
                  ncol = 6) & NoAxes() & NoLegend()

DefaultAssay(combined) <- "chromvar"
p2 <- FeaturePlot(combined,
                  features = top_tfs_ct$feature_motif,
                  reduction = "integration.wnn",
                  order = TRUE,
                  cols = bluered_colscheme(30),
                  ncol = 6) & NoAxes() & NoLegend()

p1 / p2