20 Peak-Gene Linking
Peak-gene links connect ATAC accessibility peaks to nearby genes based on the correlation between chromatin accessibility and gene expression across cells. This step is the entry point into the regulatory-element analysis: motif enrichment, chromVAR TF activity, and GRN inference in the following chapters all build on the linked peak set and the RNA/ATAC marker genes identified per cluster in the integrated object.
The object used here is the post-integration combined, i.e. the result
of the RNA CCA / ATAC / WNN integration saved at the end of the
Cross-Modal Integration chapter — the same object loaded in the Marker
Identification (integration) chapter. Cluster labels are taken from
resolution 0.8 of the WNN-integrated graph (wnn_res.0.8),
which was chosen as the working resolution for downstream annotation.
20.1 Load integrated object and prepare identities
library(Seurat)
library(Signac)
library(BSgenome.Hsapiens.UCSC.hg38)
library(dplyr)
library(arrow)


DefaultAssay(combined) <- "ATAC"

combined$cell_labels <- paste0("cluster_", combined$wsnn_res.0.5)

combined$sample_individual_condition <- paste0(combined$sample, combined$individual_condition)
combined$orig.ident <- combined$sample_individual_condition
combined$orig.ident <- gsub("_", "-", combined$orig.ident)
20.2 Restrict to standard chromosomes and compute region stats
RegionStats() computes GC content per peak using the supplied BSgenome
object, and requires every chromosome in the ATAC assay to be present in
that genome’s seqinfo. Cell Ranger ARC names contigs differently from the
standard UCSC hg38 build, so peaks on non-standard contigs are dropped first
(as in the per-sample loading chapter). The genome object’s genome() field
is also set to NA to avoid a genome-tag mismatch error between the ATAC
assay (tagged "hg38") and the BSgenome object (tagged "hg38" with a
different internal build string) — this was worked out by debugging this error:
Error in mergeNamedAtomicVectors(...) : sequences ... have incompatible genomes
standard_chroms <- standardChromosomes(BSgenome.Hsapiens.UCSC.hg38)
idx_standard_chroms <- which(as.character(seqnames(granges(combined[['ATAC']]))) %in% standard_chroms)
combined[["ATAC"]] <- subset(combined[["ATAC"]],
                               features = rownames(combined[["ATAC"]])[idx_standard_chroms])
seqlevels(combined[['ATAC']]@ranges) <- intersect(seqlevels(granges(combined[['ATAC']])),
                                                     unique(seqnames(granges(combined[['ATAC']]))))

mygenome <- BSgenome.Hsapiens.UCSC.hg38
genome(mygenome) <- NA

combined <- RegionStats(combined, genome = mygenome)
20.3 Load cluster marker genes and peaks
Marker genes and marker peaks for cluster resolution 0.8 are loaded from the
ROC-based marker table computed in the integration marker chapter
(presto::wilcoxauc). Only the
RNA markers (top_markers_ct) are used for peak-gene linking; the ATAC
markers (top_peaks_ct) are retained here for use in the TF/motif
integration chapter.
markers_genes_list_roc <- open_dataset("data/markers_genes_list_wsnn_all_resolutions.parquet")
markers_peaks_list_roc <- open_dataset("data/markers_peaks_list_wsnn_all_resolutions.parquet")

top_markers_ct <- markers_genes_list_roc %>%
  dplyr::filter(annotation == "wsnn_res.0.5") %>%  dplyr::filter(auc > 0.7) %>%
  collect()

top_peaks_ct<- markers_peaks_list_roc %>%
   dplyr::filter(annotation == "wsnn_res.0.5") %>%  dplyr::filter(auc > 0.7) %>%
  collect()
20.4 Link peaks to genes
LinkPeaks() tests, for each gene, whether accessibility at nearby peaks is
correlated with that gene’s expression across cells, restricted here to the
cluster marker genes identified above. This is computationally expensive and
is set to eval=FALSE — run manually when ready.
DefaultAssay(combined) <- "ATAC"

combined <- LinkPeaks(combined,
                        peak.assay = "ATAC",
                        expression.assay = "RNA",
                        genes.use = top_markers_ct$feature)
#> Processed 17863 groups out of 19999. 89% done. Time elapsed: 6s. ETA: 0s.Processed 19999 groups out of 19999. 100% done. Time elapsed: 7s. ETA: 0s.

SaveSeuratRds(combined, "data/seurat_object_cross_modal_integration_peakslinks.rds")
20.5 Coverage plot example
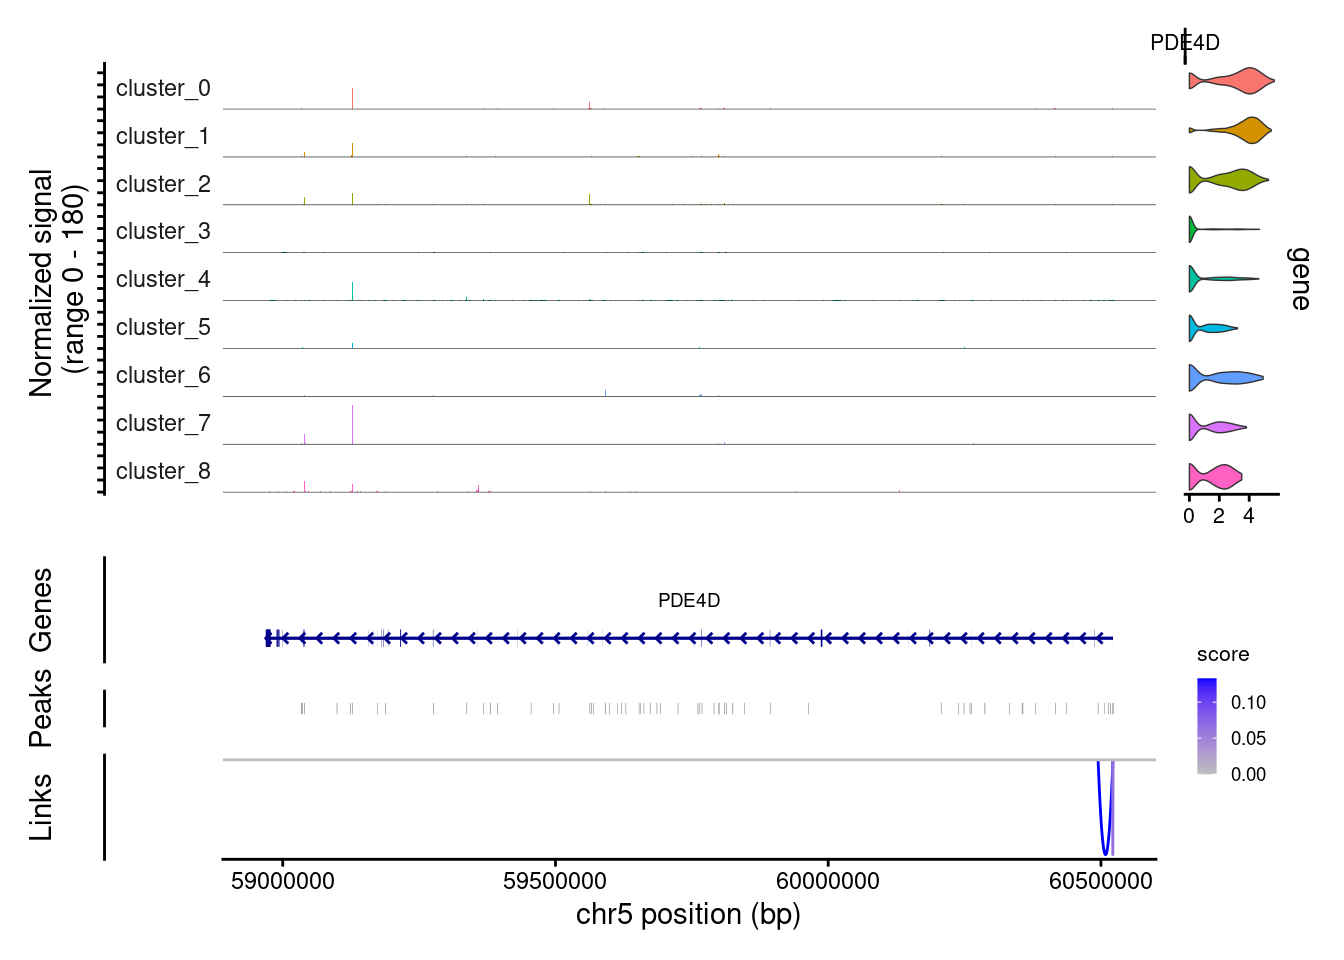
Coverage plots visualise linked peaks alongside gene structure and per-group
accessibility. PDE4D is shown here as an example gene from the marker set.
DefaultAssay(combined) <- "ATAC"

p1 <- CoveragePlot(combined,
                   region = "PDE4D",
                   features = "PDE4D",
                   group.by = "cell_labels",
                   extend.upstream = 1000,
                   extend.downstream = 1000)
p1