5 RNA QC
RNA quality control evaluates the integrity and complexity of the gene
expression library for each cell. The three core metrics are: number of
detected genes (nFeature_RNA), total UMI counts (nCount_RNA), and
percentage of reads mapping to mitochondrial genes (percent.mt).
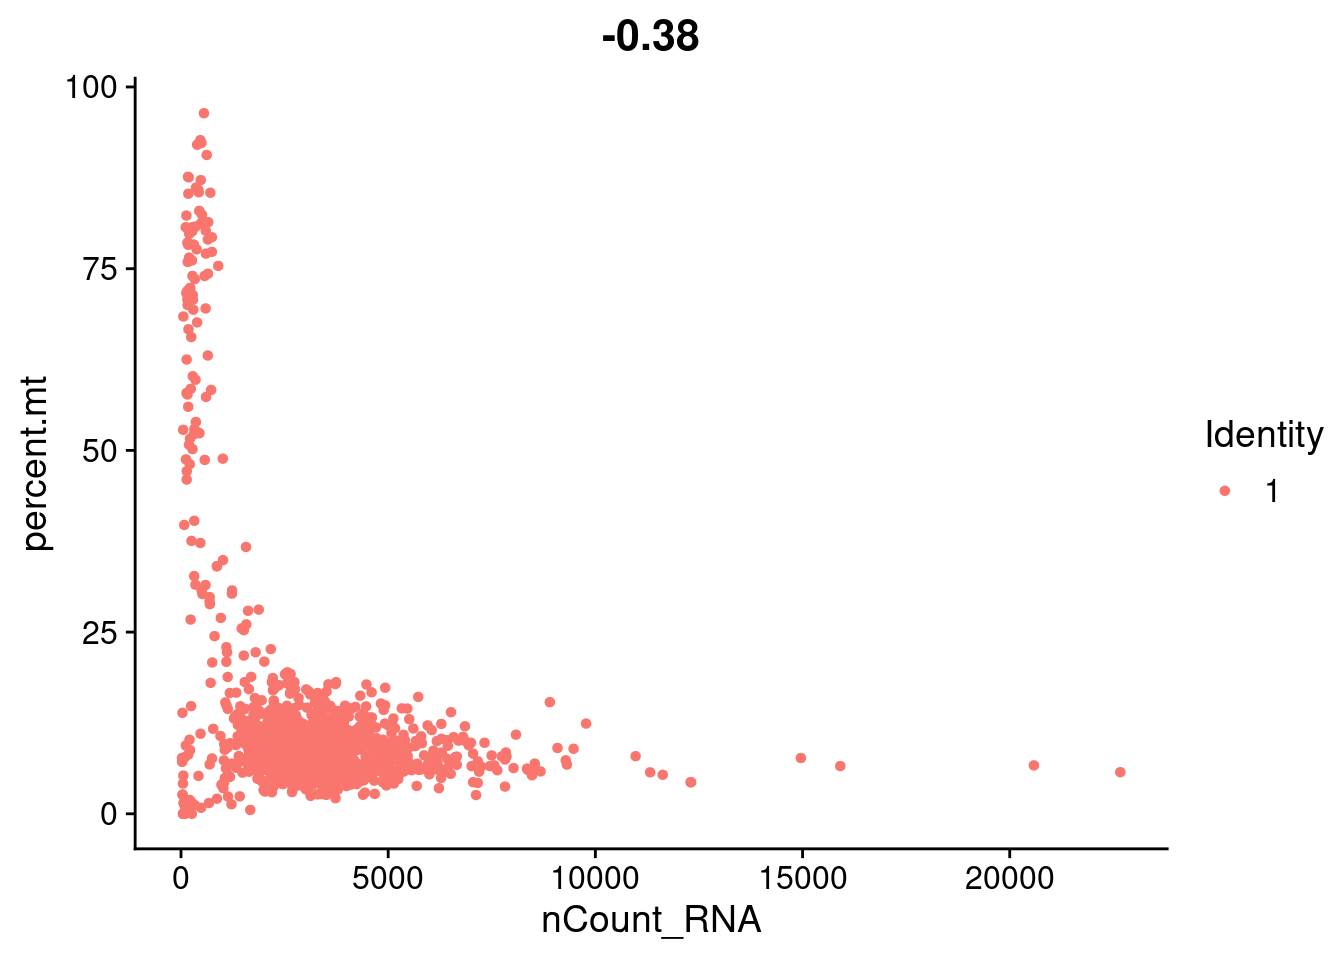
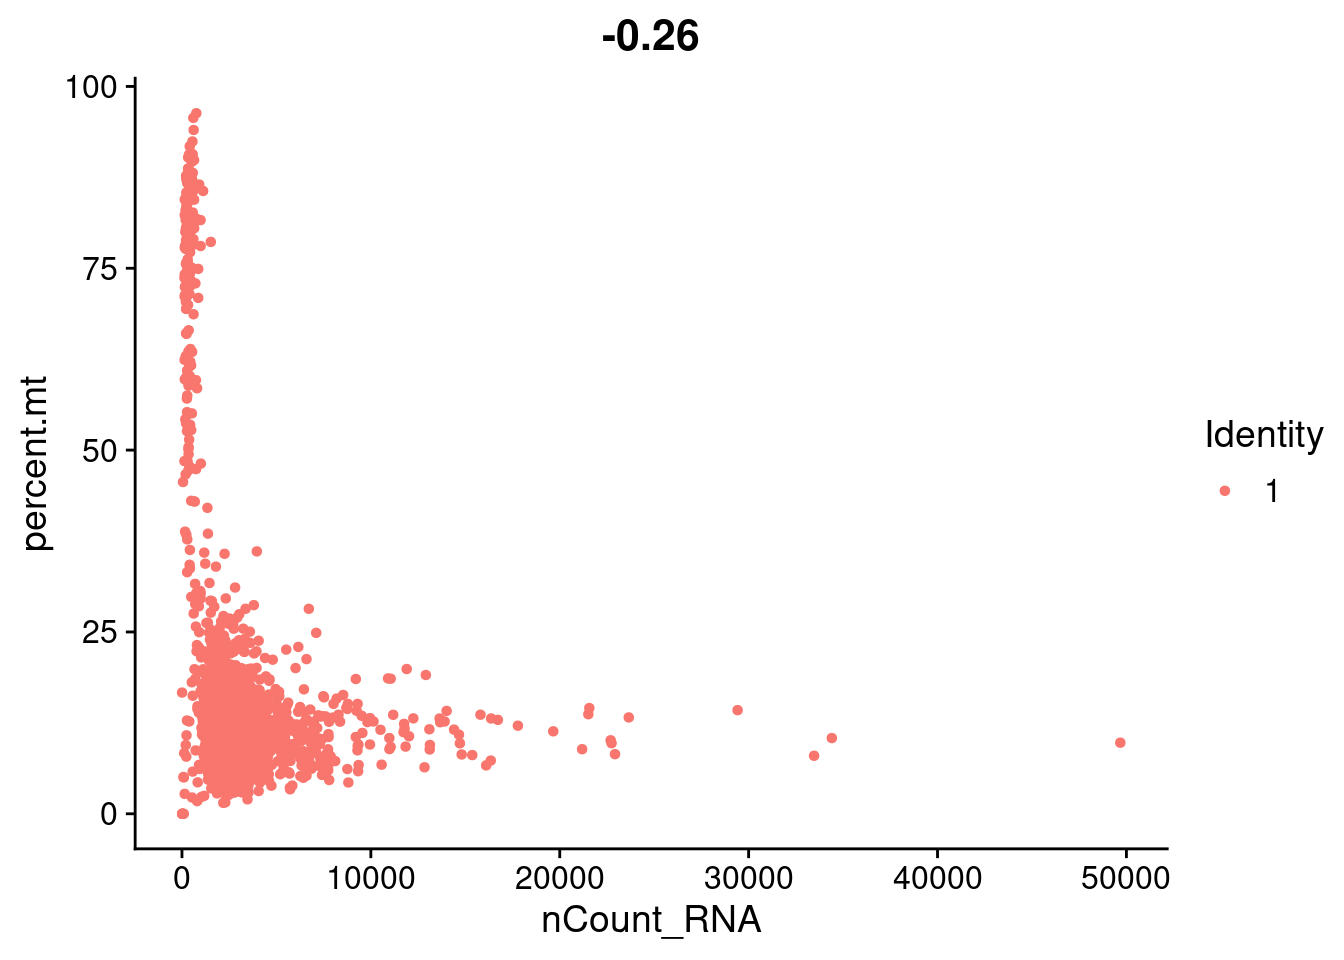
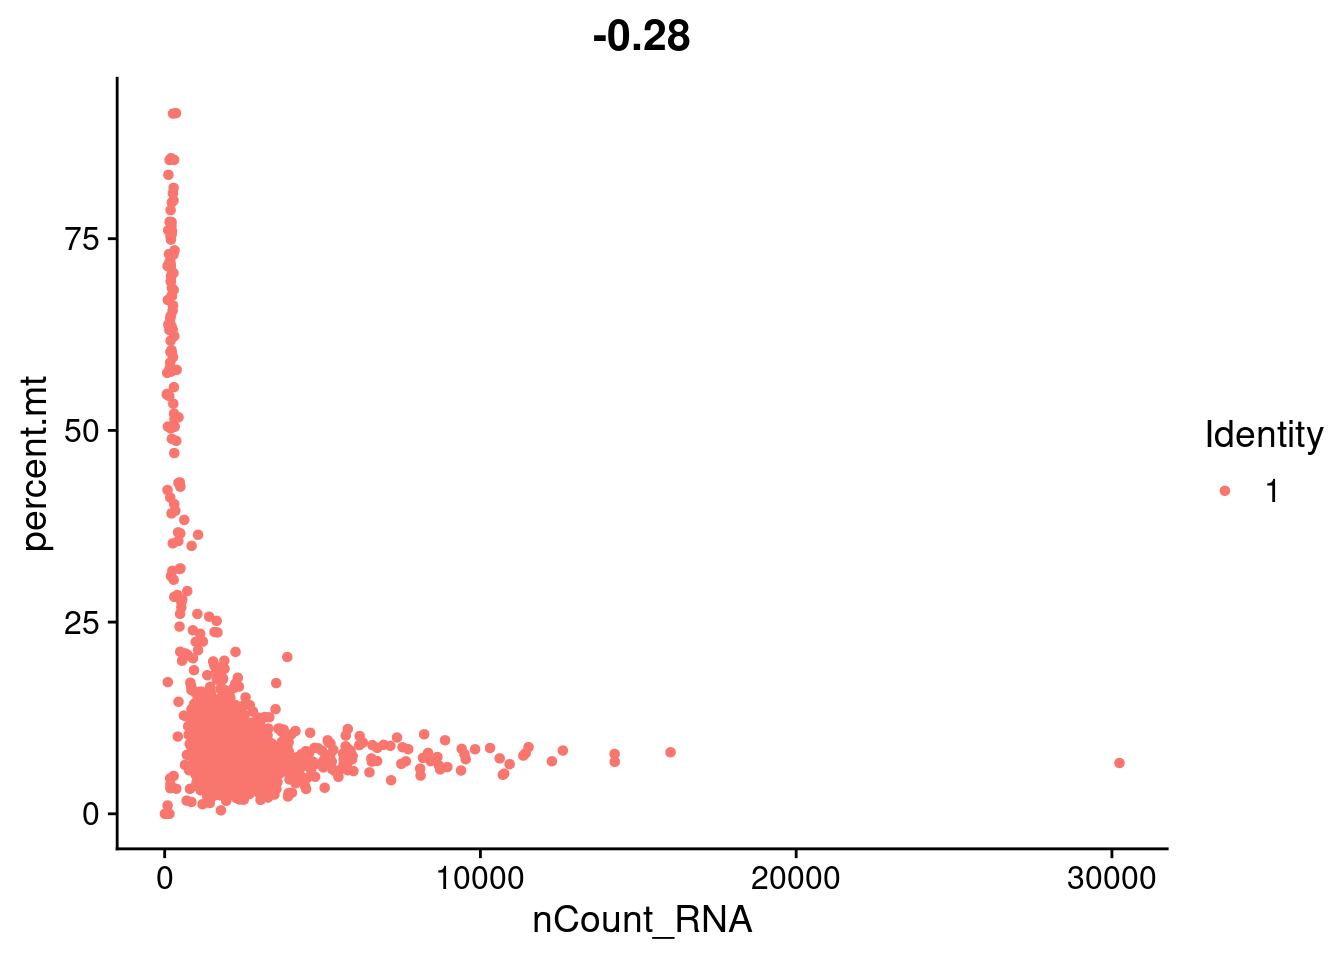
The relationship between nCount_RNA and percent.mt is particularly
informative — high nCount_RNA with high percent.mt reflects a healthy
metabolically active cell with high mitochondrial expression, while low
nCount_RNA with high percent.mt reflects a dying or damaged cell whose
cytoplasmic RNA has leaked out. The same logic applies to nFeature_RNA.
5.1 Compute mitochondrial percentage
Compute per-cell mitochondrial read percentage for each sample. This metric is added to the Seurat object metadata alongside the demultiplexing annotations already present.
cntsB <- PercentageFeatureSet(cntsB, pattern = "^MT-", col.name = "percent.mt", assay = "RNA")
cntsC <- PercentageFeatureSet(cntsC, pattern = "^MT-", col.name = "percent.mt", assay = "RNA")
cntsD <- PercentageFeatureSet(cntsD, pattern = "^MT-", col.name = "percent.mt", assay = "RNA")
5.2 Distribution of RNA QC metrics per sample
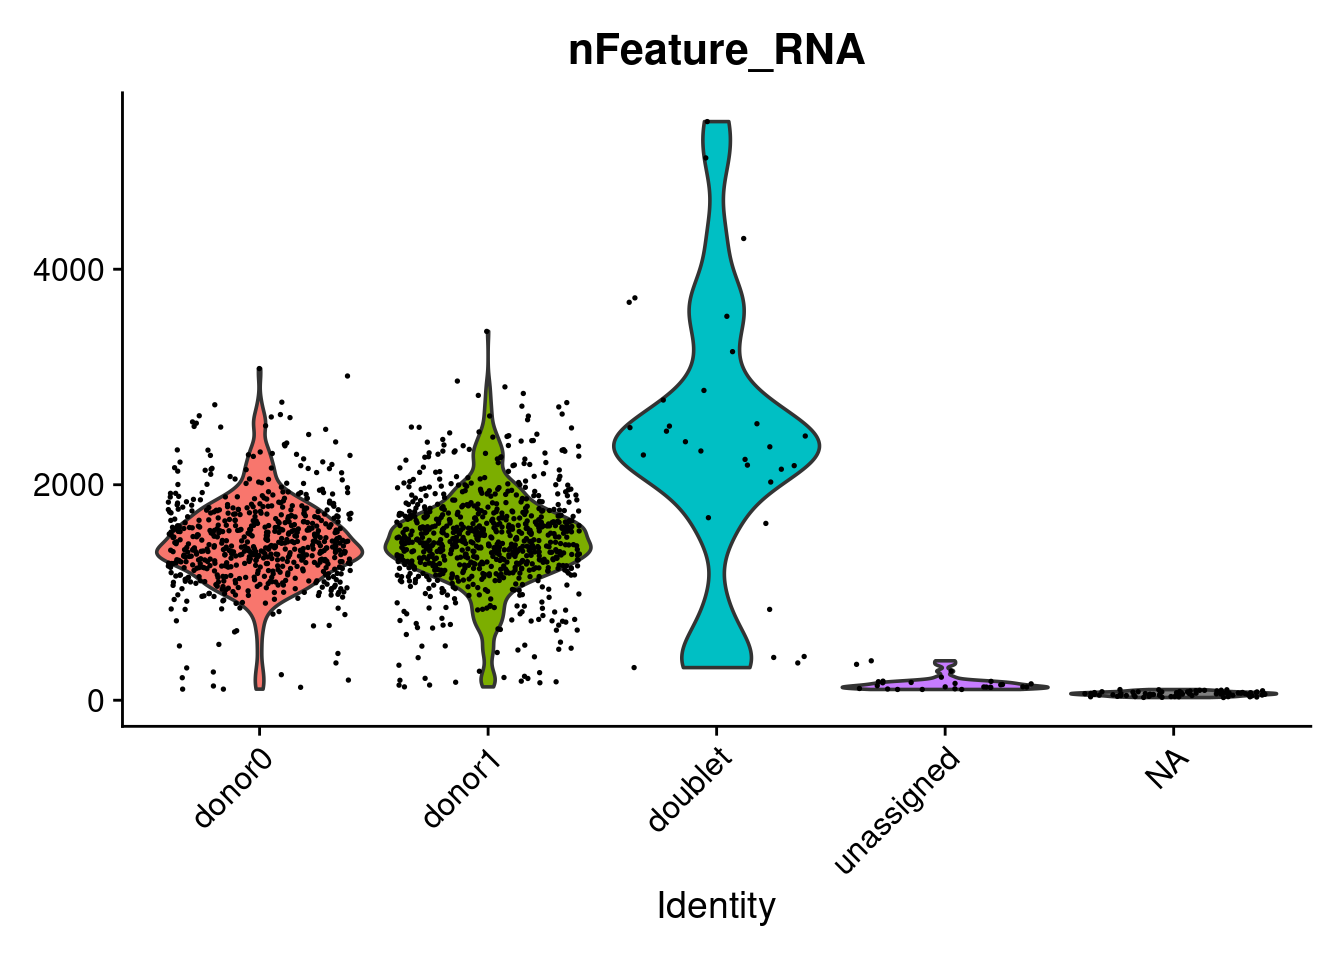
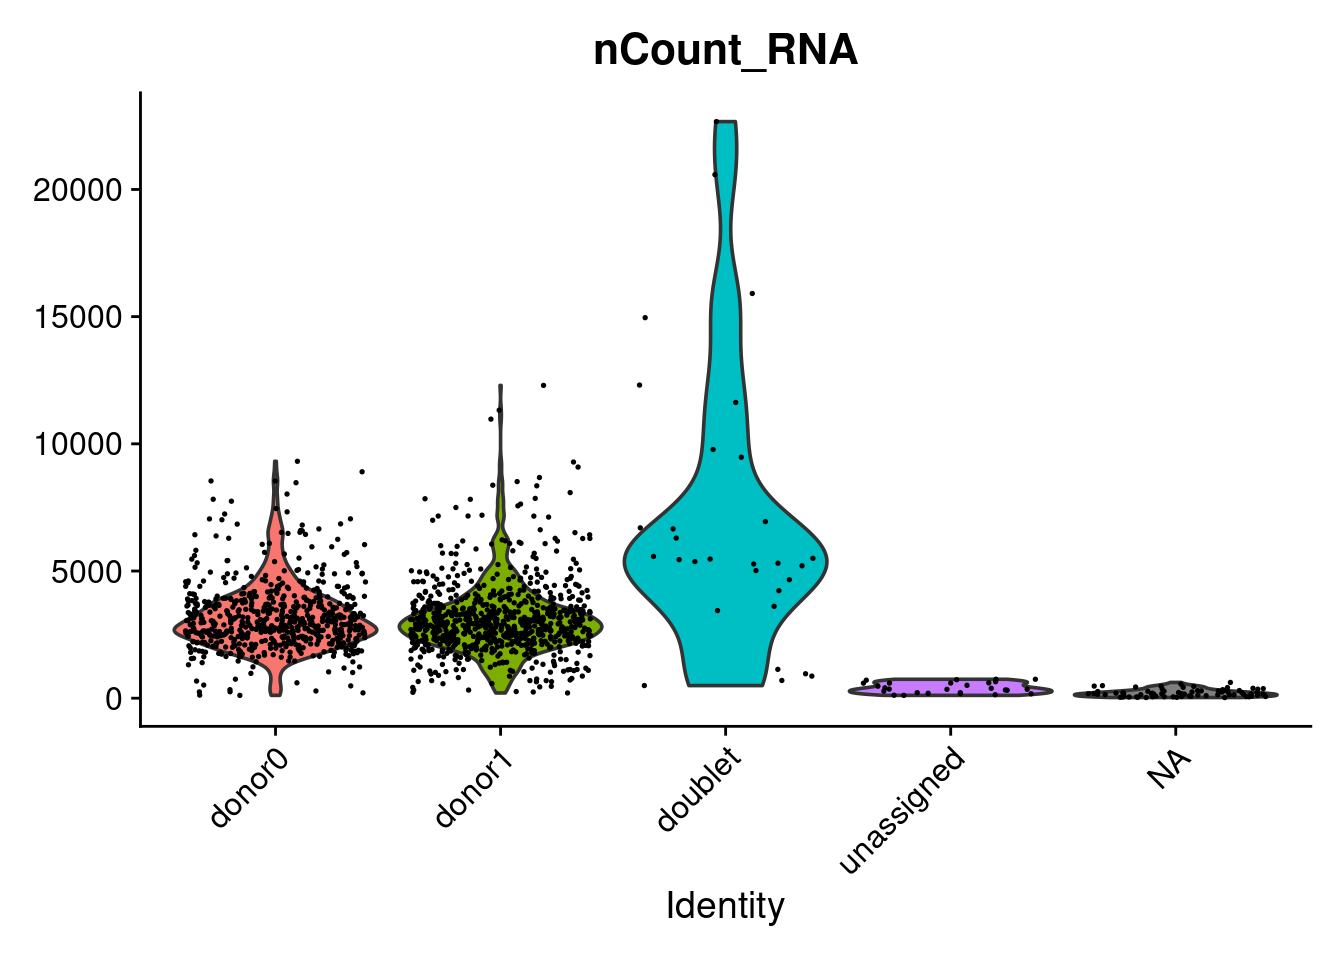
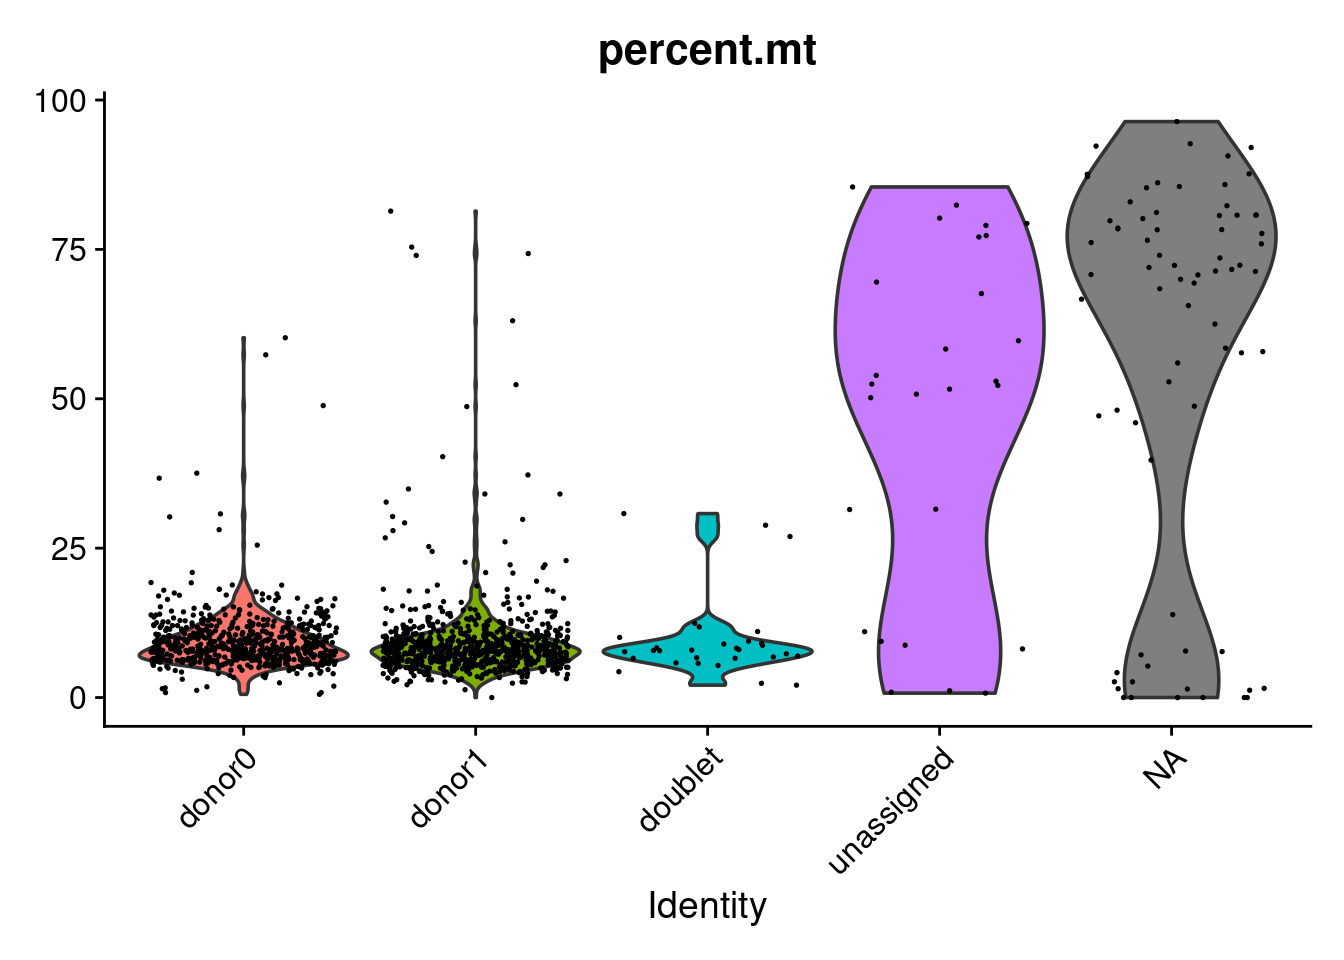
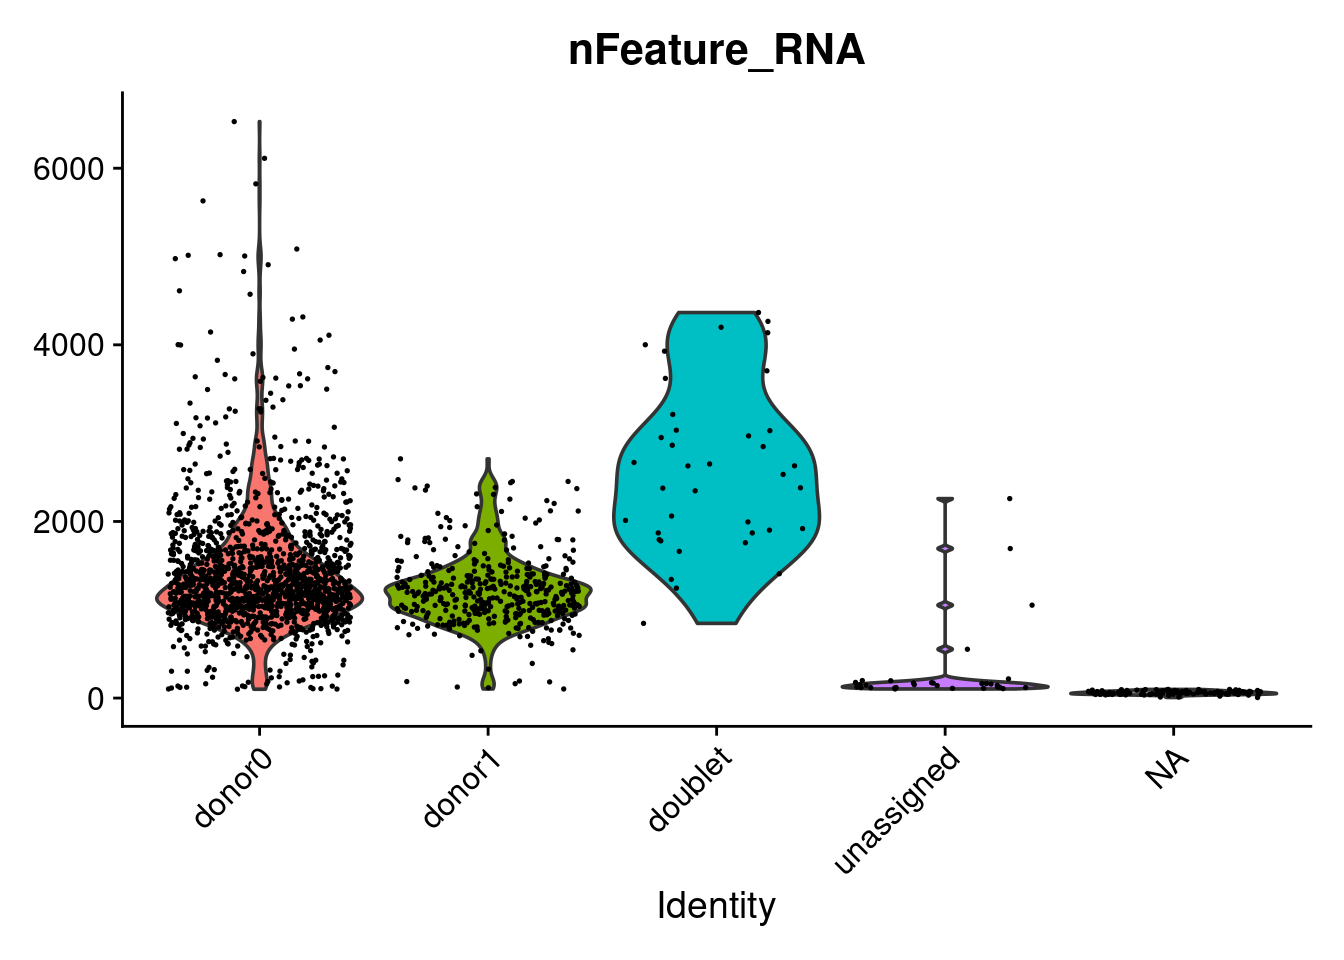
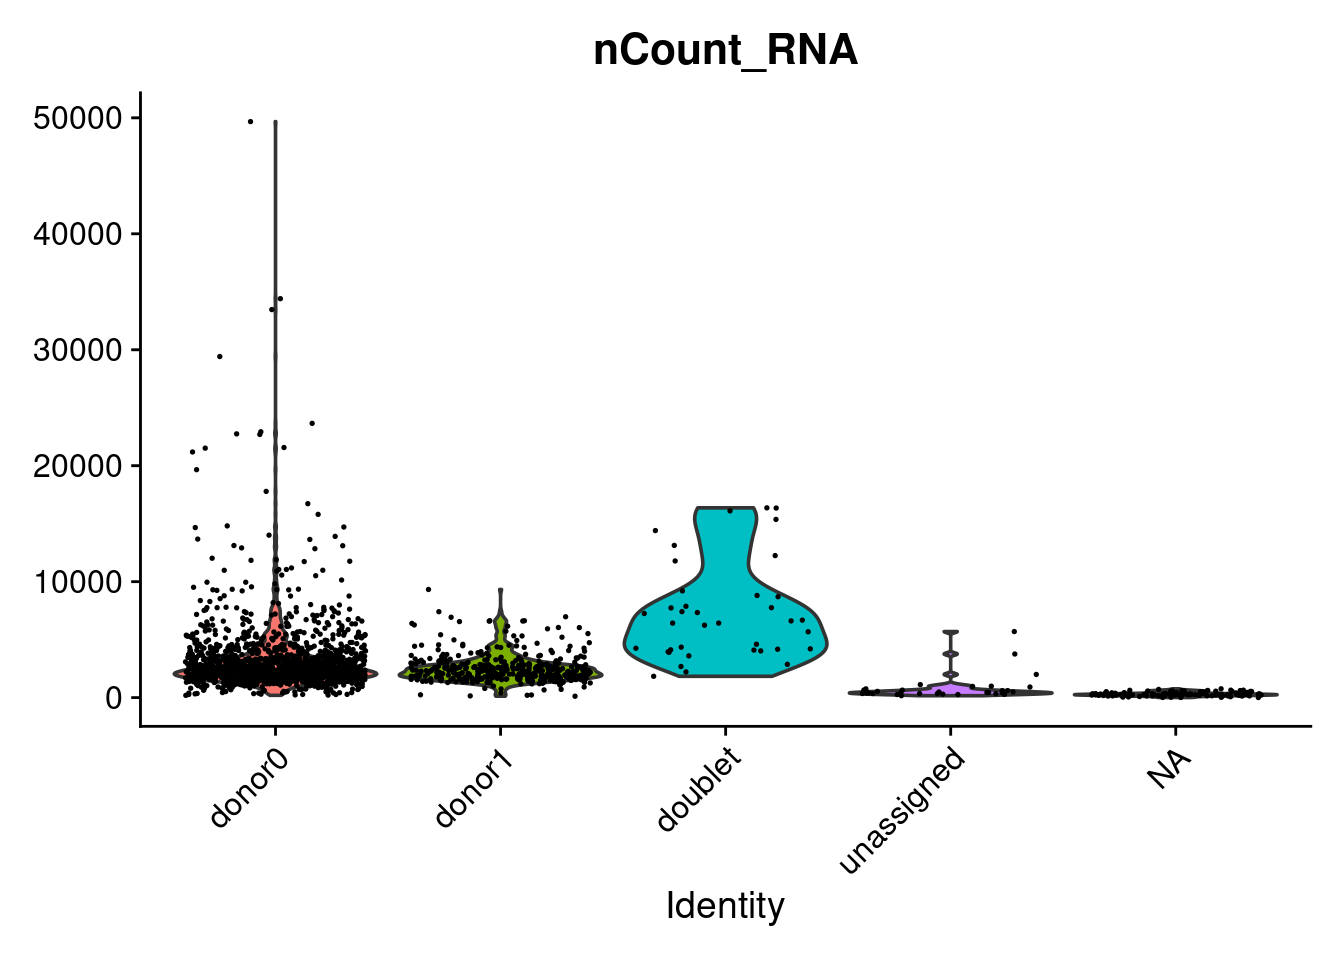
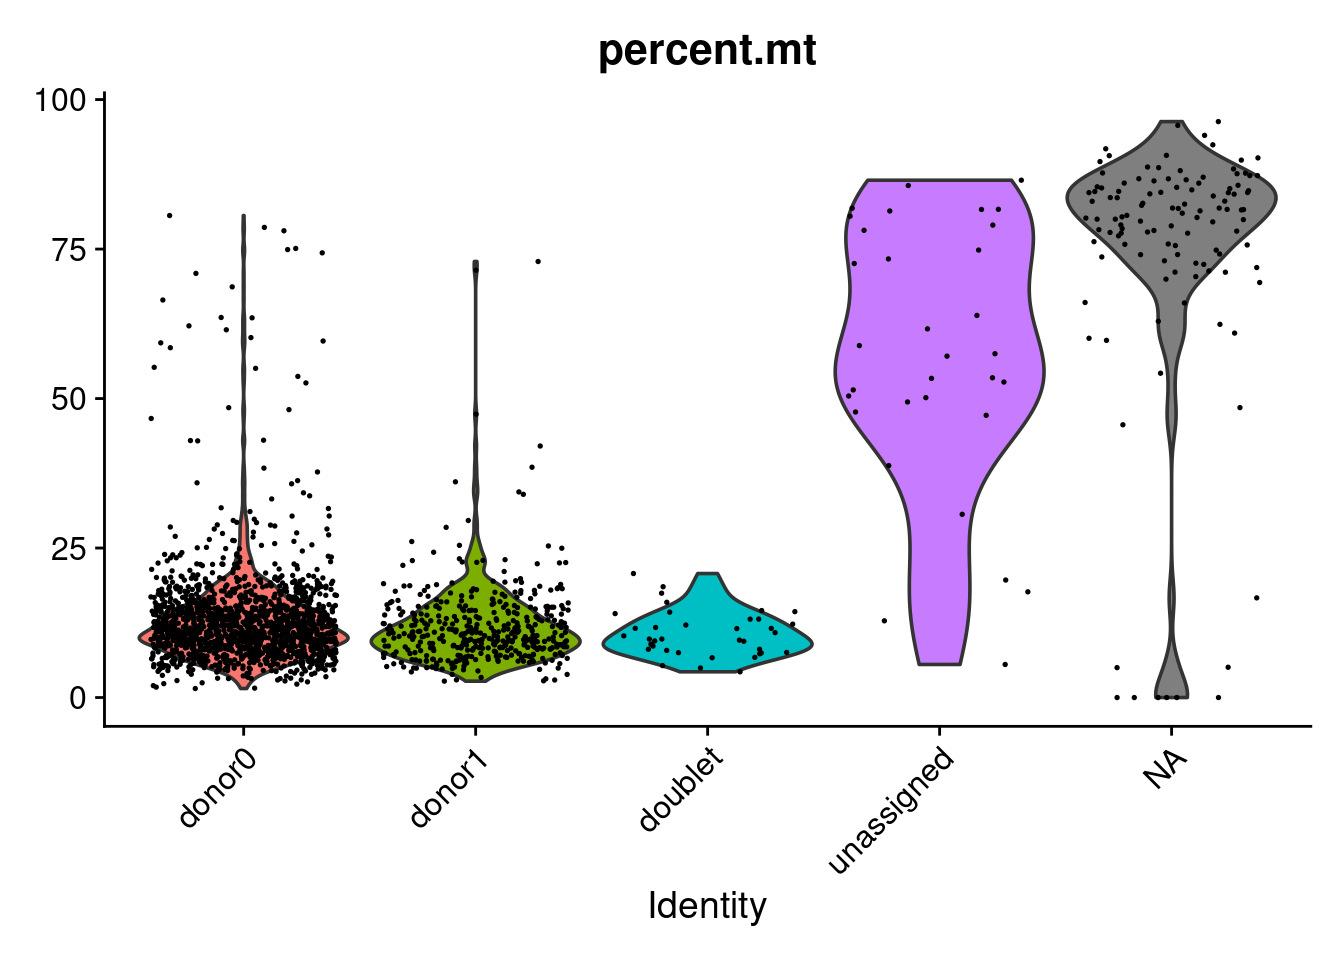
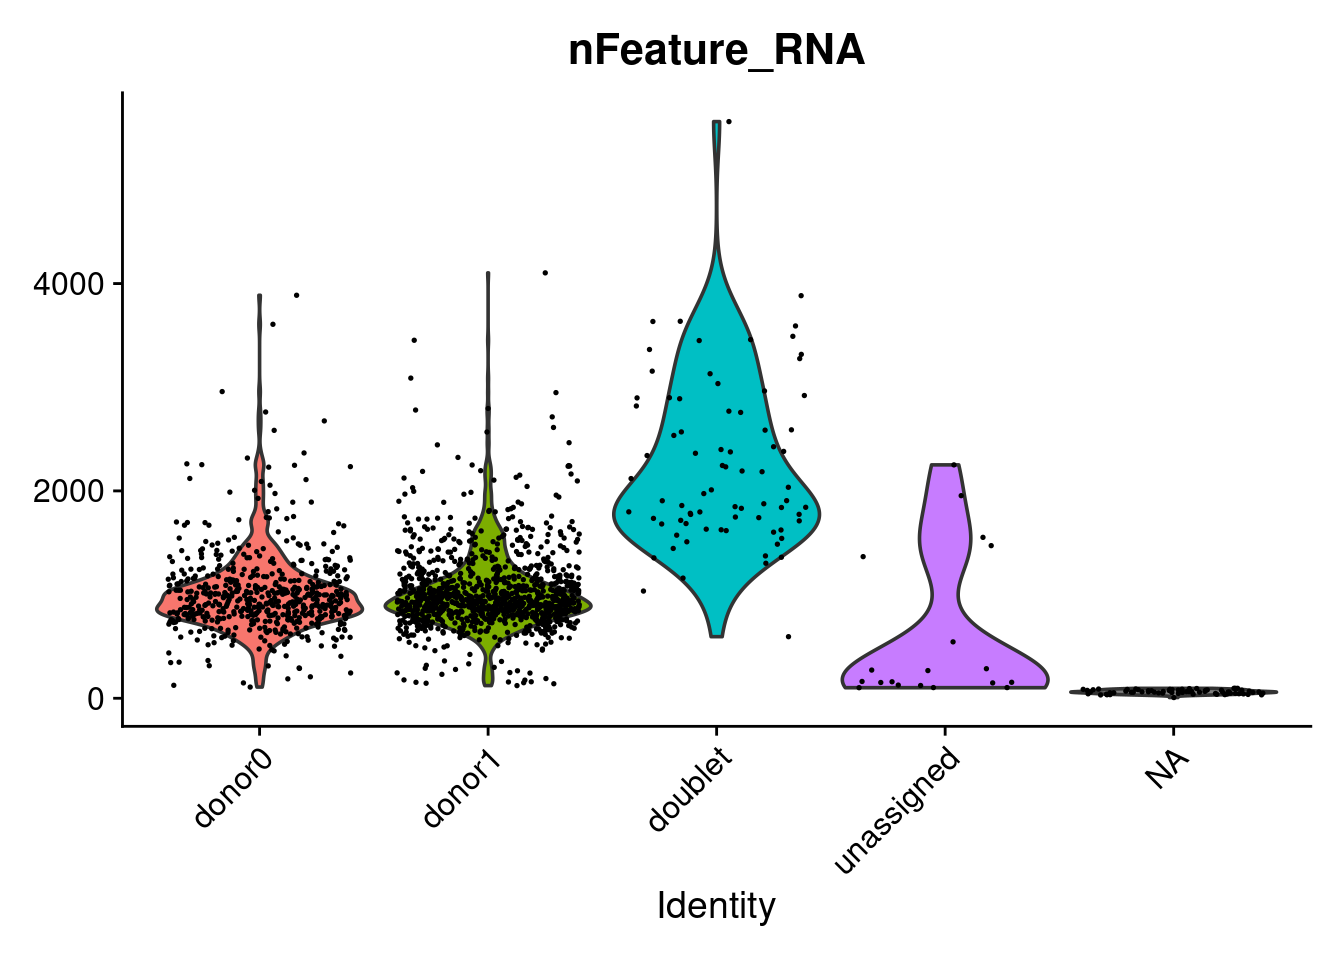
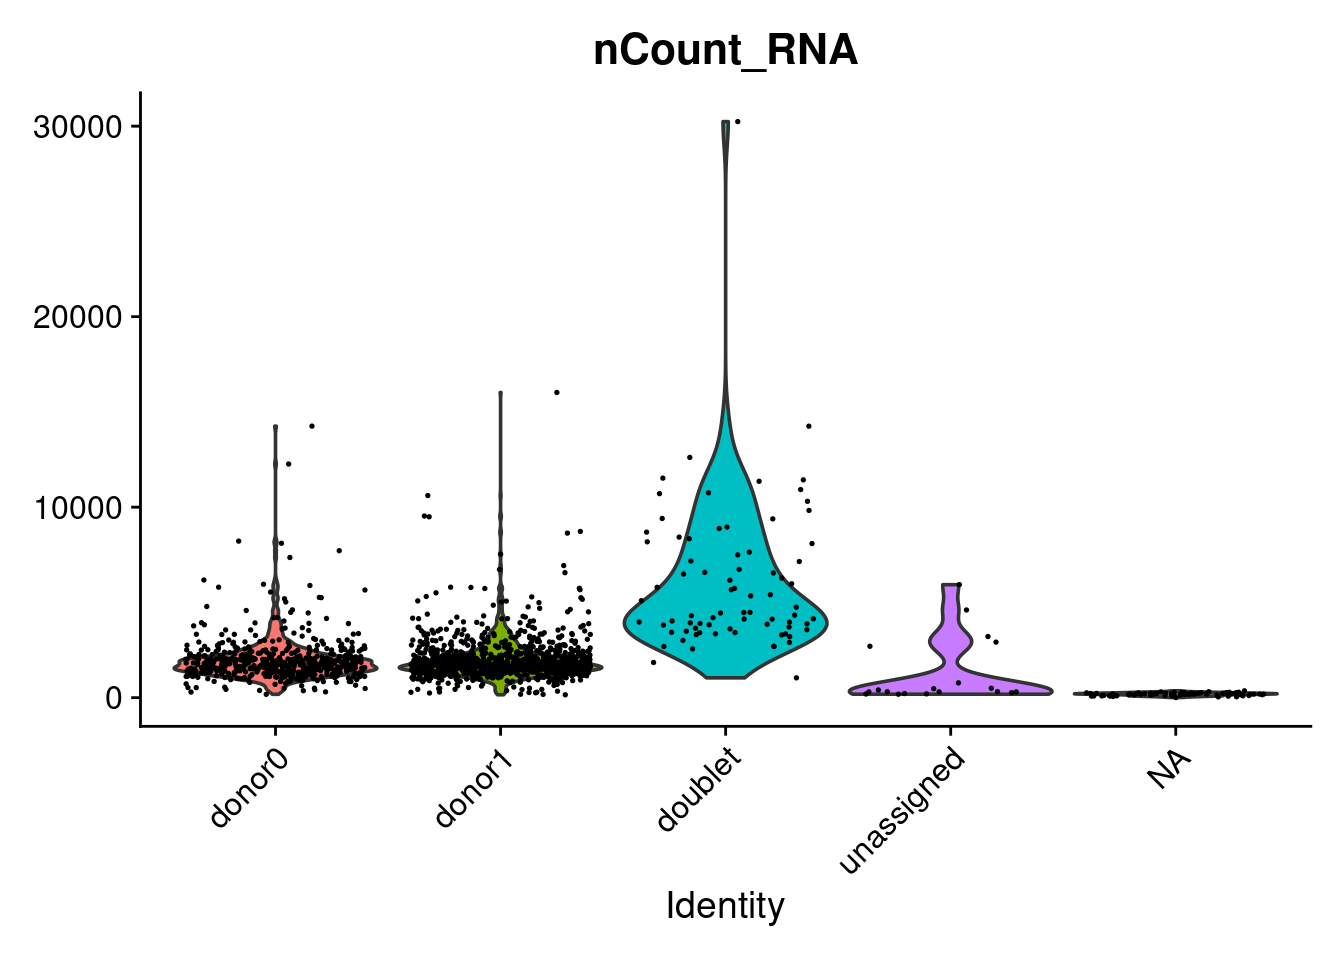
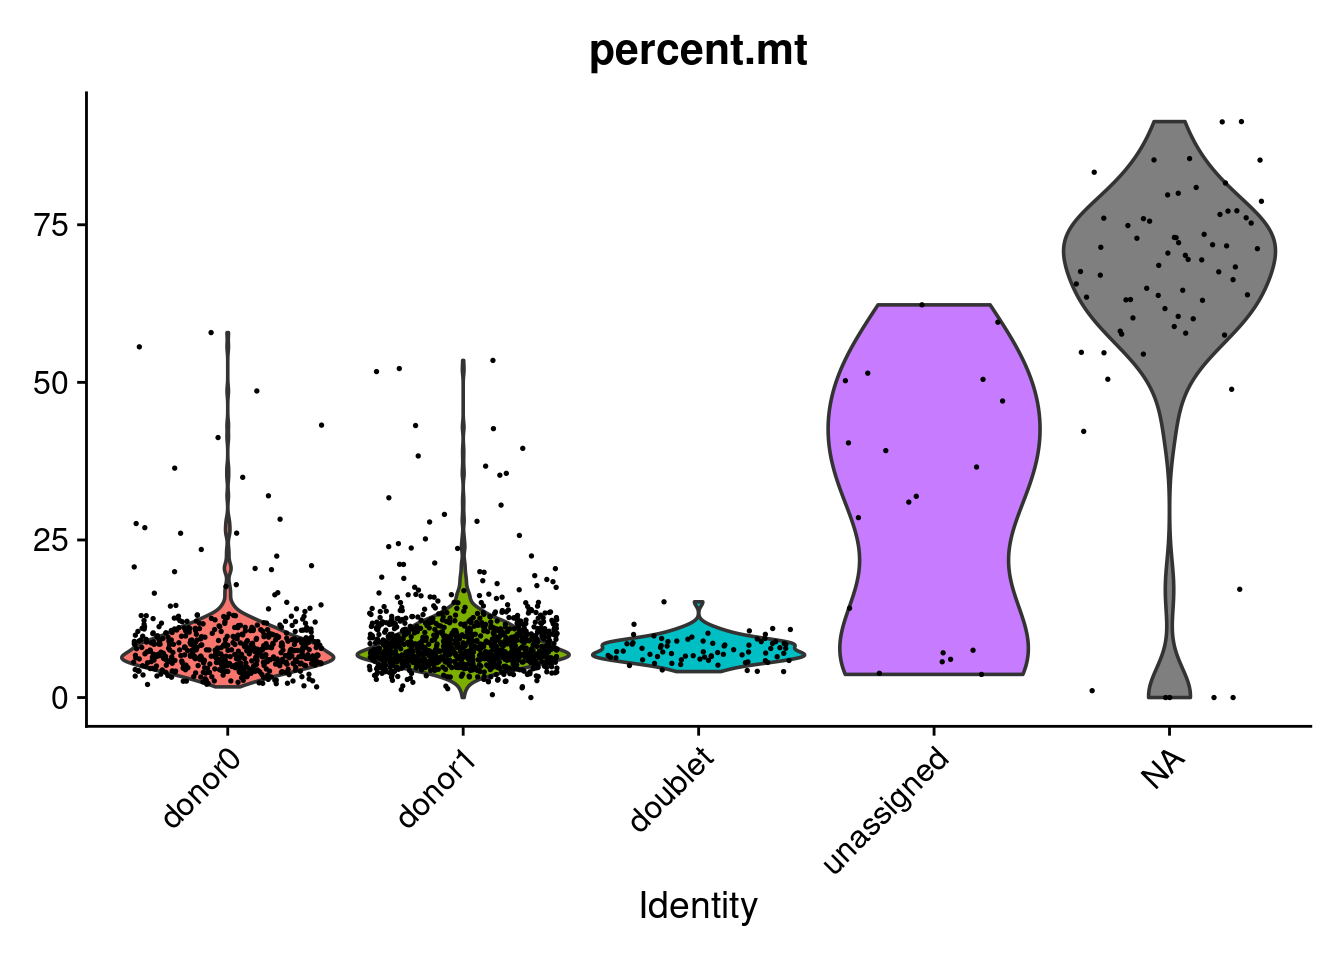
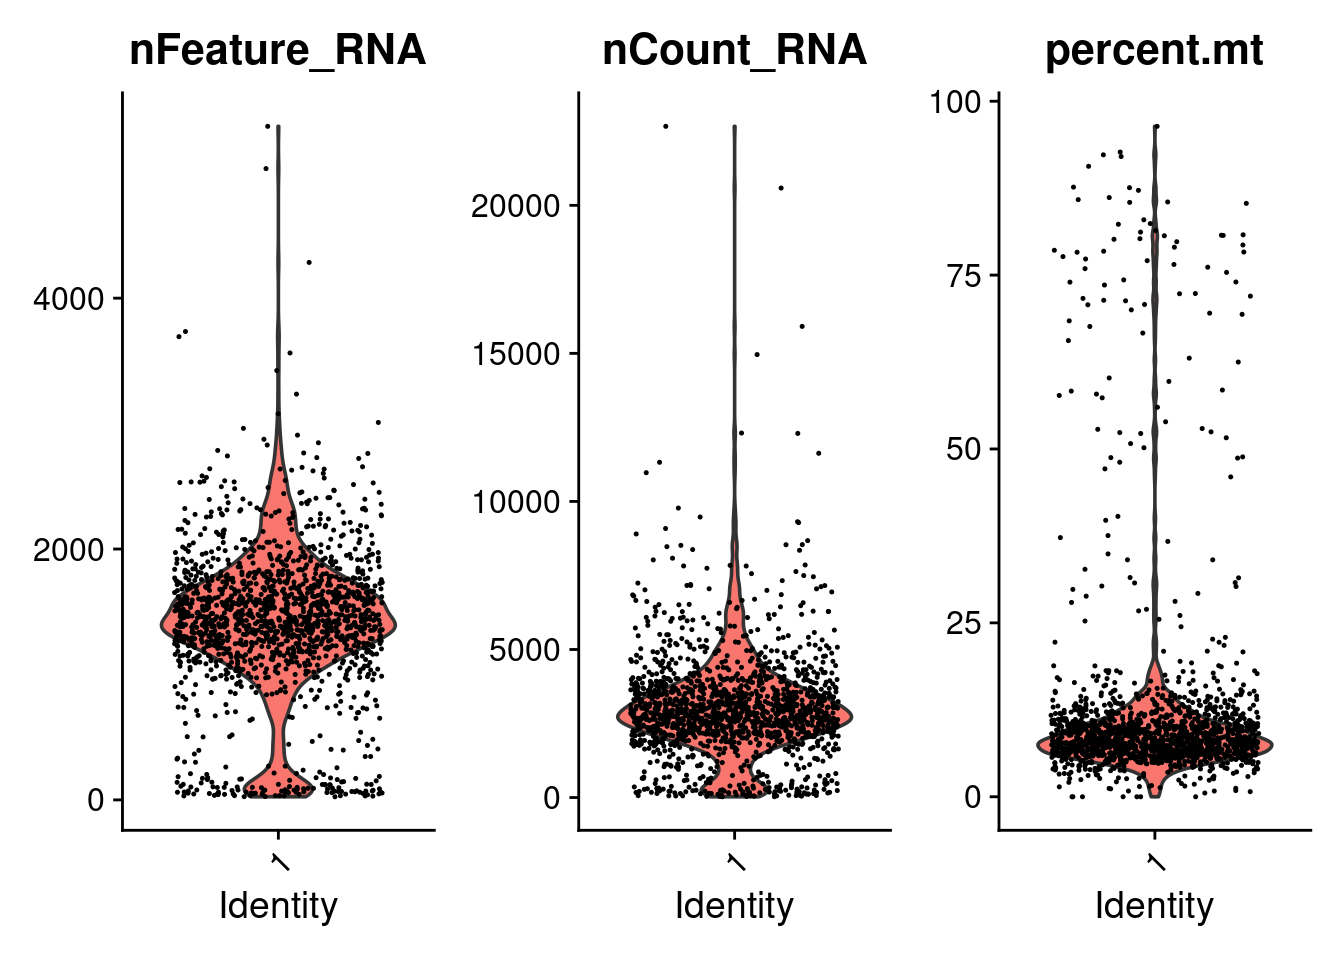
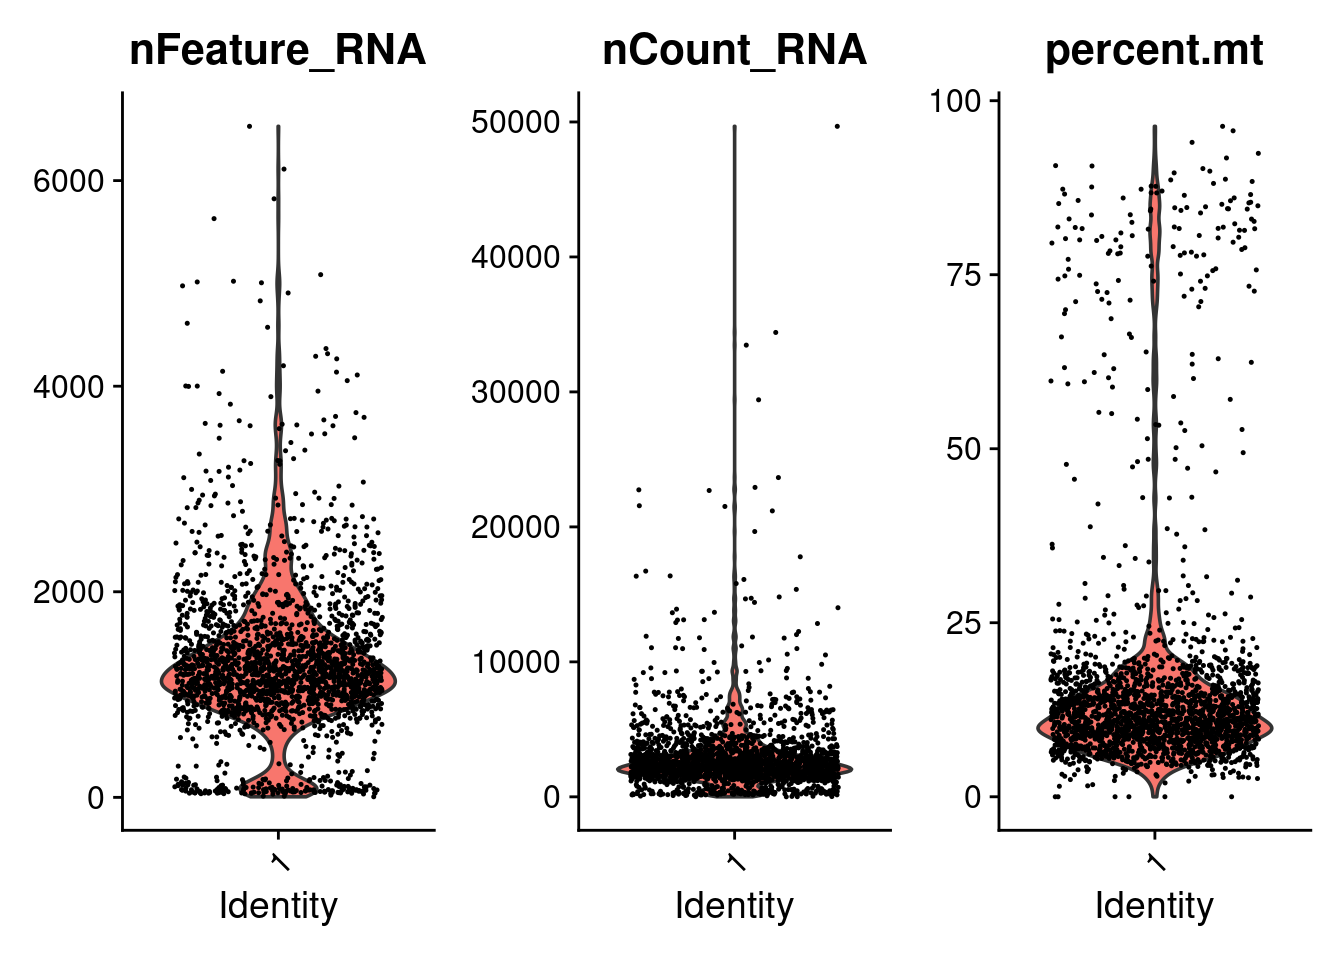
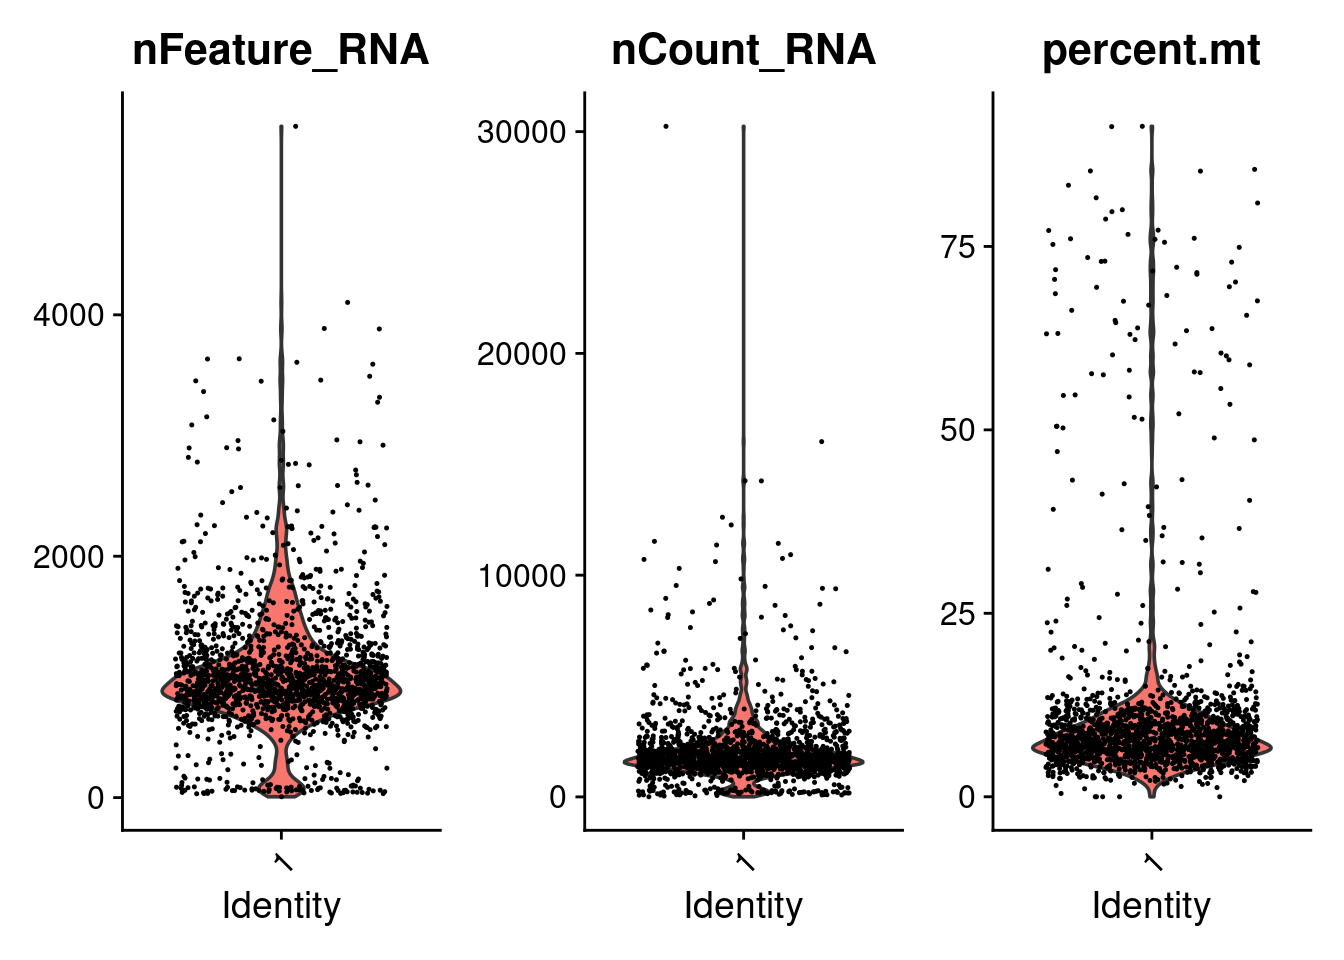
Violin plots of nFeature_RNA, nCount_RNA, and percent.mt for each
sample. These distributions guide the choice of filtering thresholds applied
in the Cell Filtering chapter.
5.3 Read count vs mitochondrial percentage
Scatter plot of total UMI counts against mitochondrial read percentage.
Cells in the upper-left quadrant (low nCount_RNA, high percent.mt) are
likely damaged and will be excluded in the filtering step.
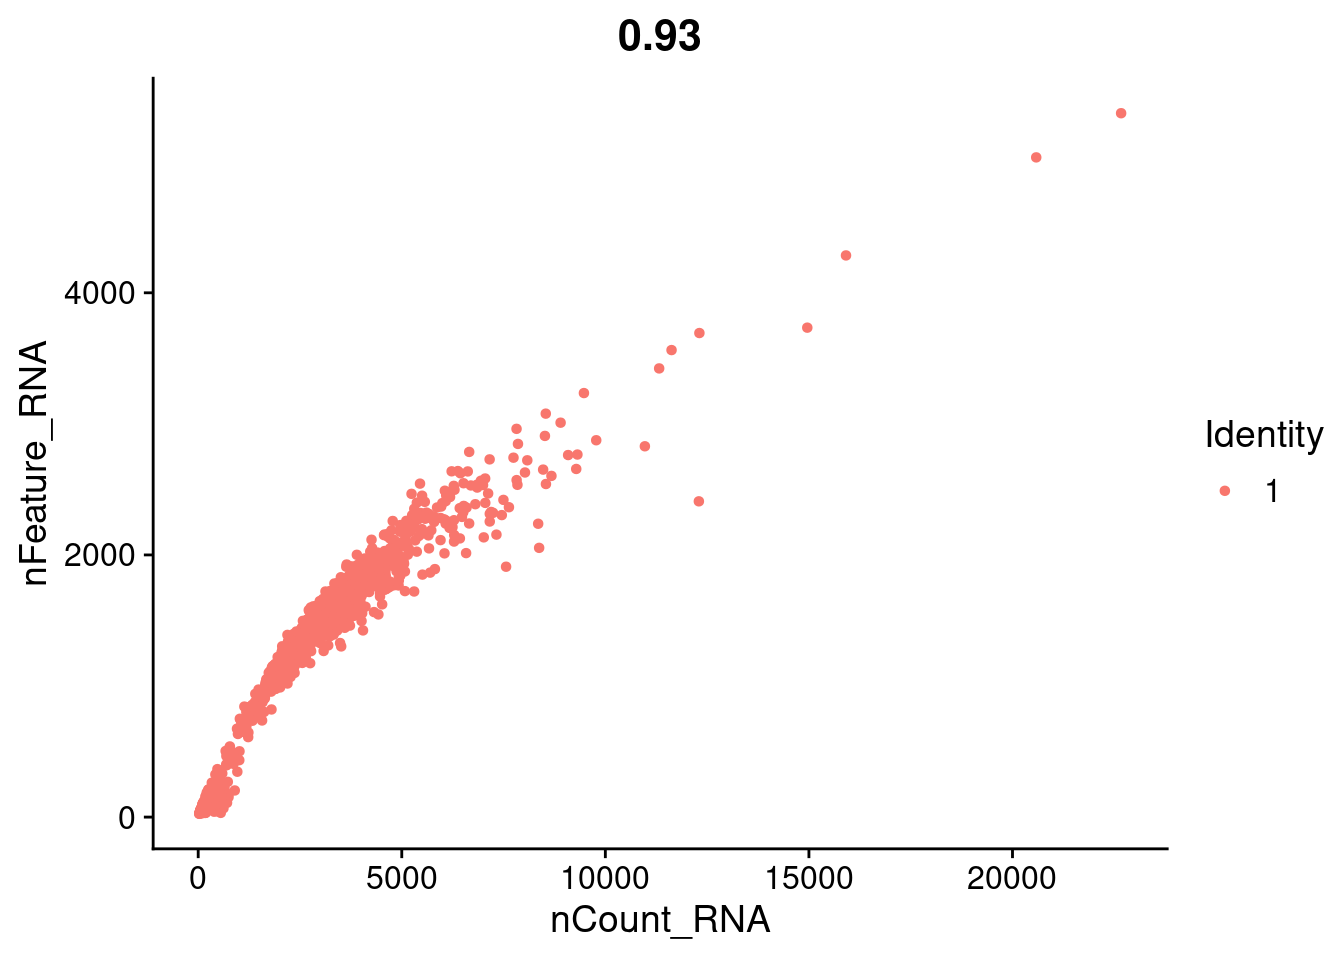
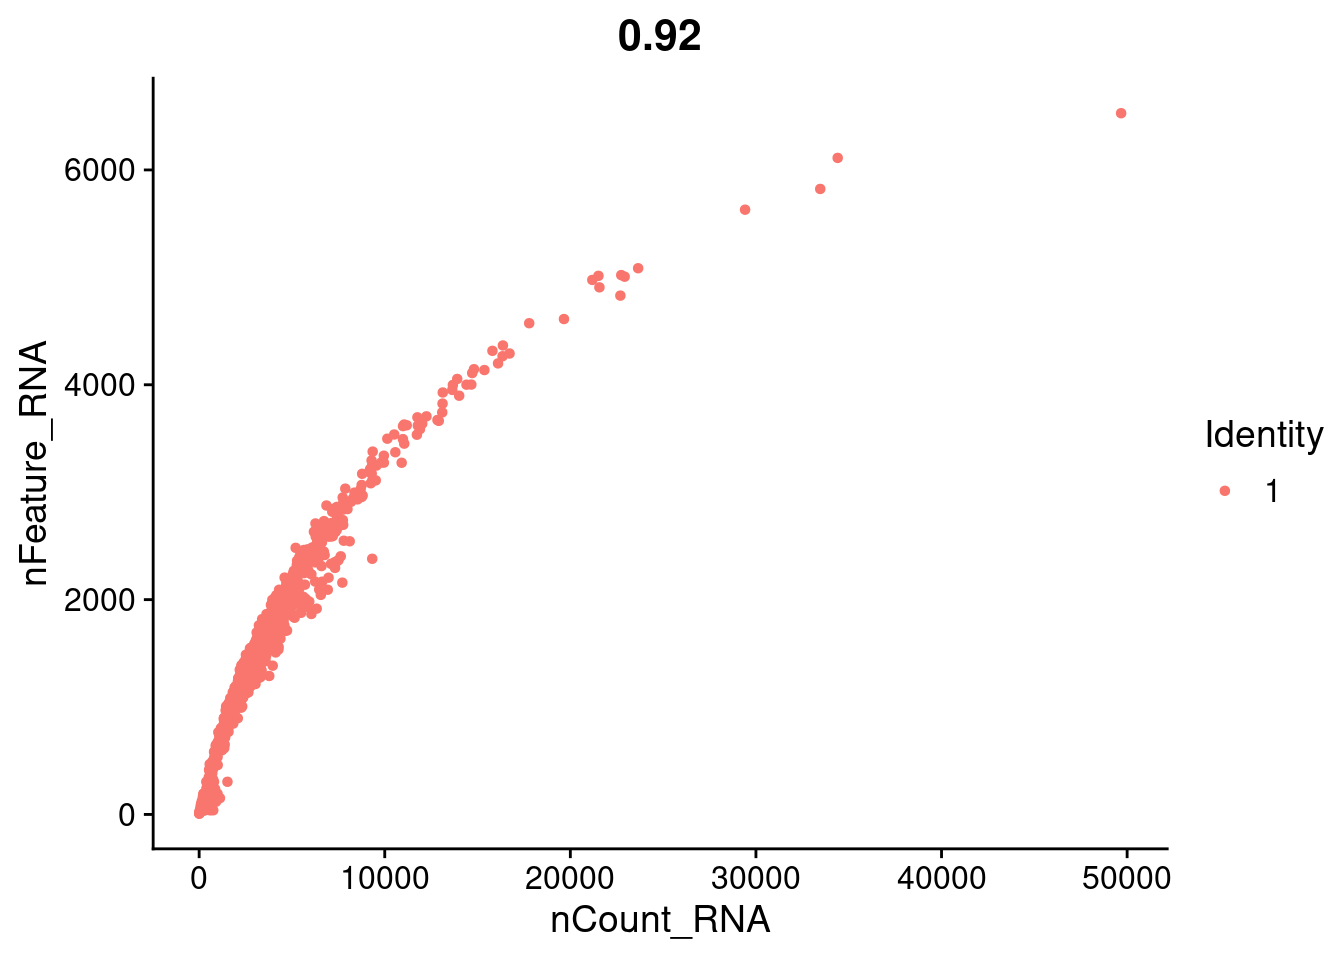
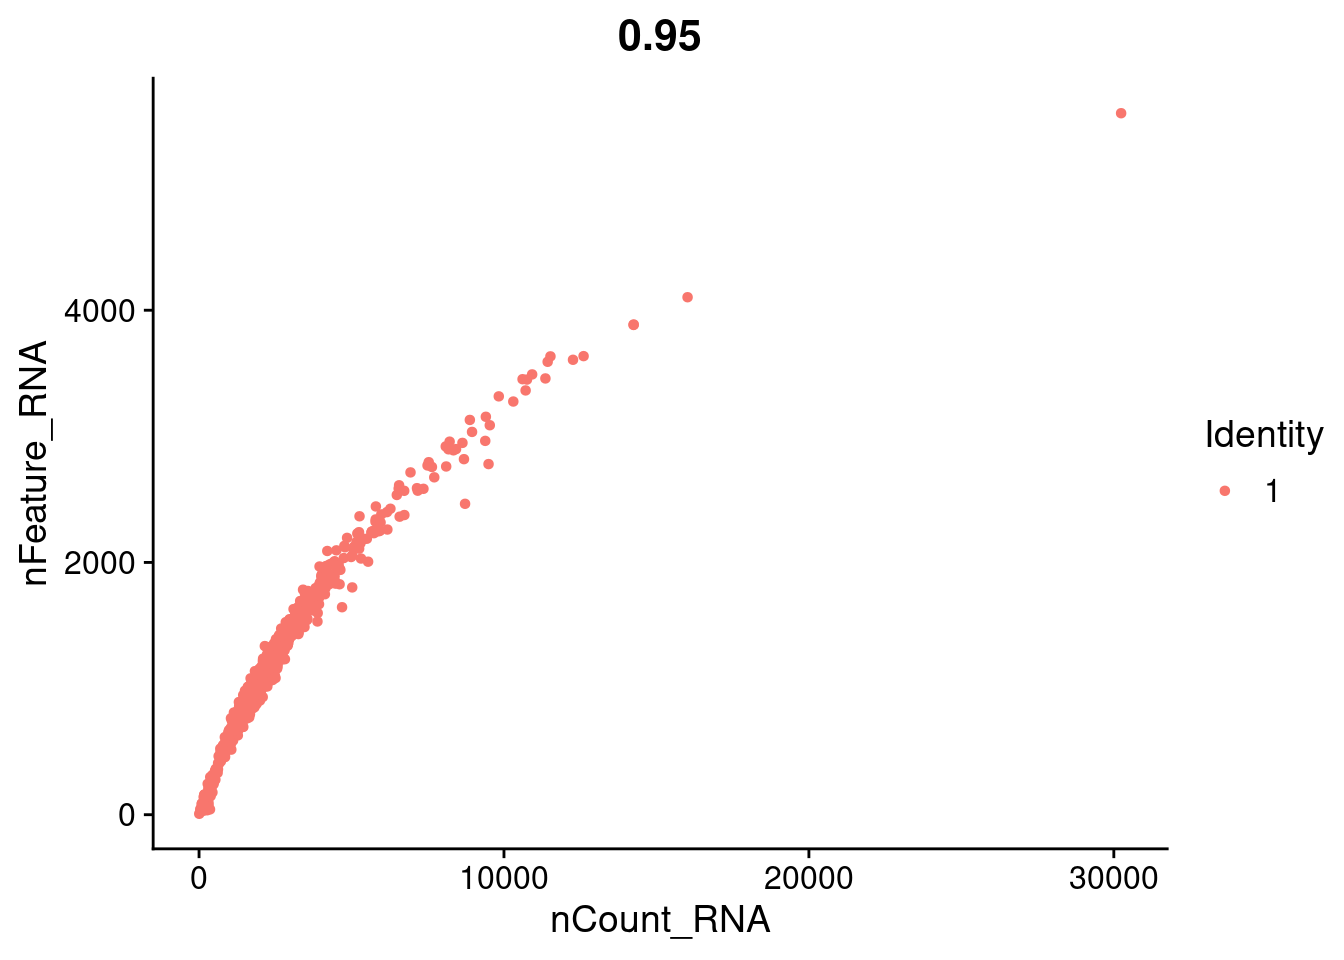
5.4 Feature count vs read count
Scatter plot of detected gene count against total UMI count. A linear relationship is expected for healthy cells. Outliers above the trend (high genes per UMI) may indicate doublets; outliers below may reflect low-quality cells or empty droplets.