7 ChIPseeker Peak Annotation
Cell Ranger ARC’s own peak-to-gene annotation is cross-checked here against
an independent annotation from ChIPseeker::annotatePeak(), for each
sample’s set of accessible peaks split by Healthy vs. PASC. This is a
validation step on the raw per-sample data (as loaded in the Data Loading
chapter), rather than a step in the main integration pipeline, so it does
not depend on the merged combined object.
7.2 Per-sample donor -> condition mapping
Reuses the sample/donor -> condition assignment established in the Donor Assignment chapter.
condition_by_sample_donor <- c(
  "Sample_B_donor1" = "PASC",    "Sample_B_donor0" = "Healthy",
  "Sample_C_donor0" = "PASC",    "Sample_C_donor1" = "Healthy",
  "Sample_D_donor0" = "PASC",    "Sample_D_donor1" = "Healthy"
)
7.3 Annotate accessible peaks per sample
For each sample: the raw filtered feature-barcode matrix is loaded, cells
are labelled Healthy/PASC from the SNP demultiplexing result, ATAC counts
are aggregated by condition, and peaks with non-zero counts in each
condition are annotated against Cell Ranger’s own atac_peak_annotation.tsv
and against ChIPseeker::annotatePeak().
annotate_sample_peaks <- function(sample_name, cellranger_dir) {
  raw.lib <- Read10X_h5(file.path(cellranger_dir, "outs/filtered_feature_bc_matrix.h5"))

  cnts <- CreateSeuratObject(counts = raw.lib$`Gene Expression`,
                             assay = "RNA",
                             project = sample_name,
                             names.delim = "-", names.field = 2)

  cnts[["ATAC"]] <- CreateChromatinAssay(
    counts = raw.lib$Peaks,
    fragments = file.path(cellranger_dir, "outs/atac_fragments.tsv.gz"),
    sep = c(":", "-"),
    genome = "hg38"
  )

  demux <- read.table(file.path(dirname(cellranger_dir),
                                "scSNPdemux", paste0(basename(cellranger_dir), ".demux"),
                                "results/donor_ids.tsv"),
                      header = TRUE)
  rownames(demux) <- demux$cell
  cnts <- AddMetaData(cnts, metadata = demux)
  cnts$sample_donor <- paste0(sample_name, "_", cnts$donor_id)

  cnts$individual_condition <- unname(condition_by_sample_donor[cnts$sample_donor])

  sum_peaks <- AggregateExpression(cnts, group.by = "individual_condition", assays = "ATAC")[["ATAC"]]
  bool_mat <- as.matrix(sum_peaks > 0)

  peak_anno <- read.table(file.path(cellranger_dir, "outs/atac_peak_annotation.tsv"),
                          sep = "\t", header = TRUE)
  peak_anno$name <- paste0(peak_anno$chrom, "-", peak_anno$start, "-", peak_anno$end)

  make_peak_gr <- function(condition) {
    peaks_found <- data.frame(name = names(which(bool_mat[, condition])))
    xx <- merge(peak_anno, peaks_found)
    GRanges(seqnames = xx$chrom,
           ranges = IRanges(start = xx$start, end = xx$end),
           peak_type = xx$peak_type)
  }

  conditions <- colnames(bool_mat)
  peakAnno1 <- annotatePeak(make_peak_gr(conditions[1]),
                            TxDb = TxDb.Hsapiens.UCSC.hg38.knownGene,
                            tssRegion = c(-3000, 3000), annoDb = "org.Hs.eg.db")
  peakAnno2 <- annotatePeak(make_peak_gr(conditions[2]),
                            TxDb = TxDb.Hsapiens.UCSC.hg38.knownGene,
                            tssRegion = c(-3000, 3000), annoDb = "org.Hs.eg.db")

  list(conditions = conditions, peakAnno1 = peakAnno1, peakAnno2 = peakAnno2)
}
7.4 Sample B
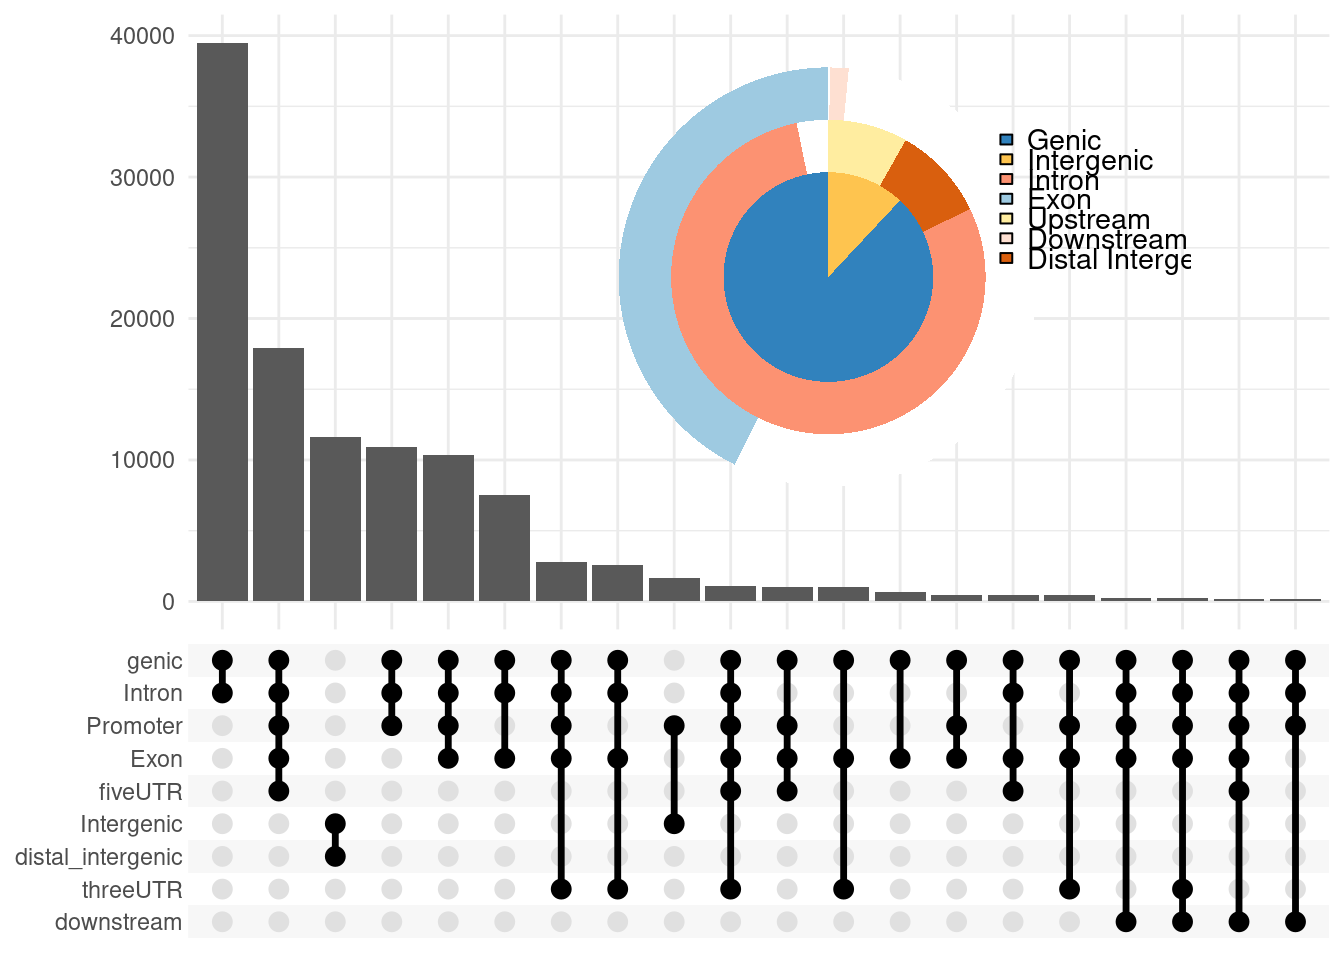
resultB <- annotate_sample_peaks("Sample_B", "~/data/tasks/liam.kealy/processing/cellranger_SC_ATAC_covid_B")Healthy
upsetplot(resultB$peakAnno1, vennpie = TRUE) 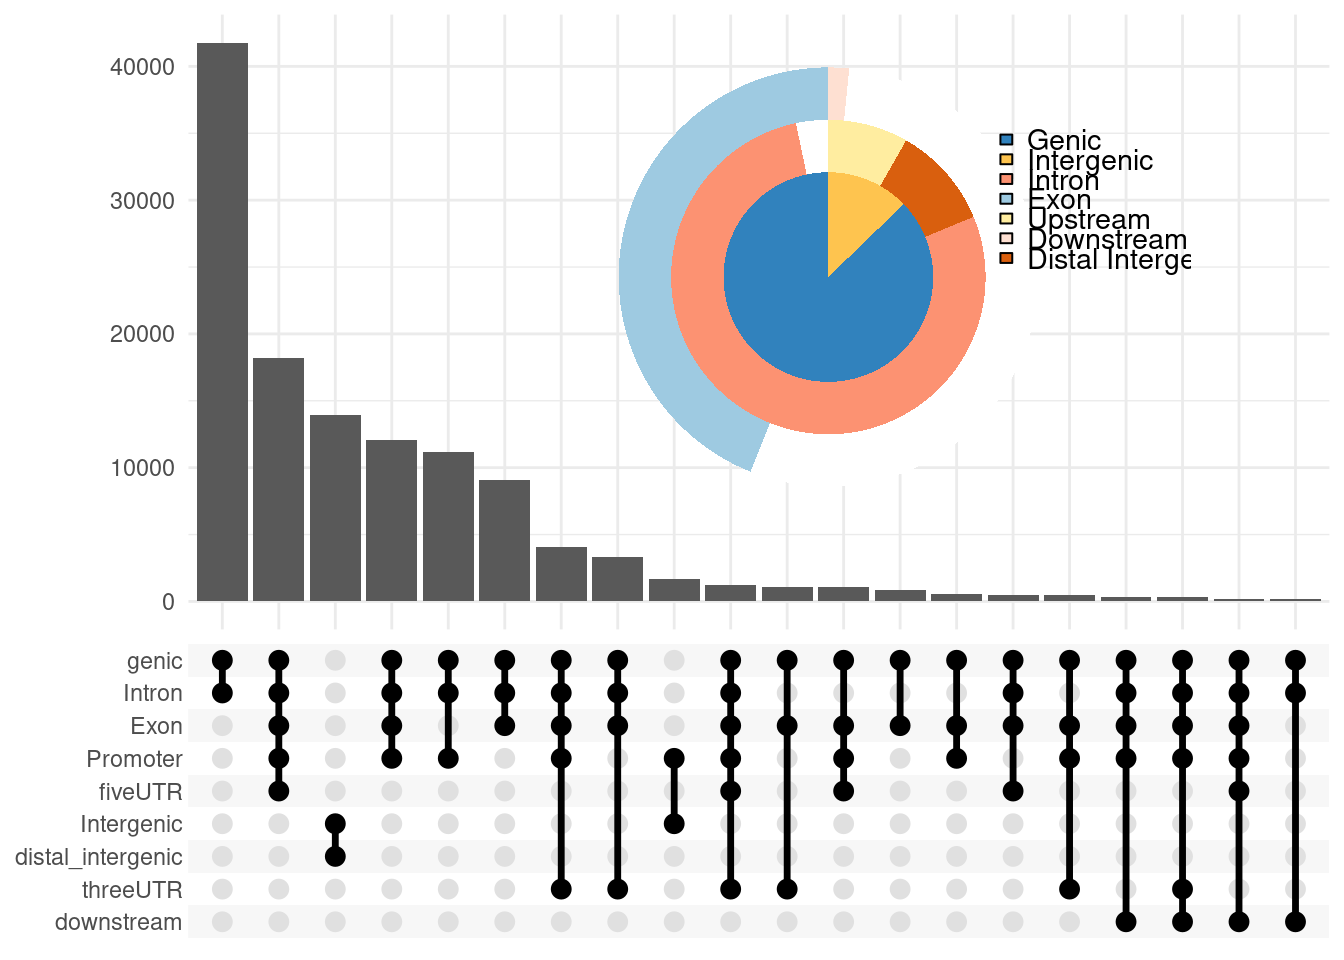
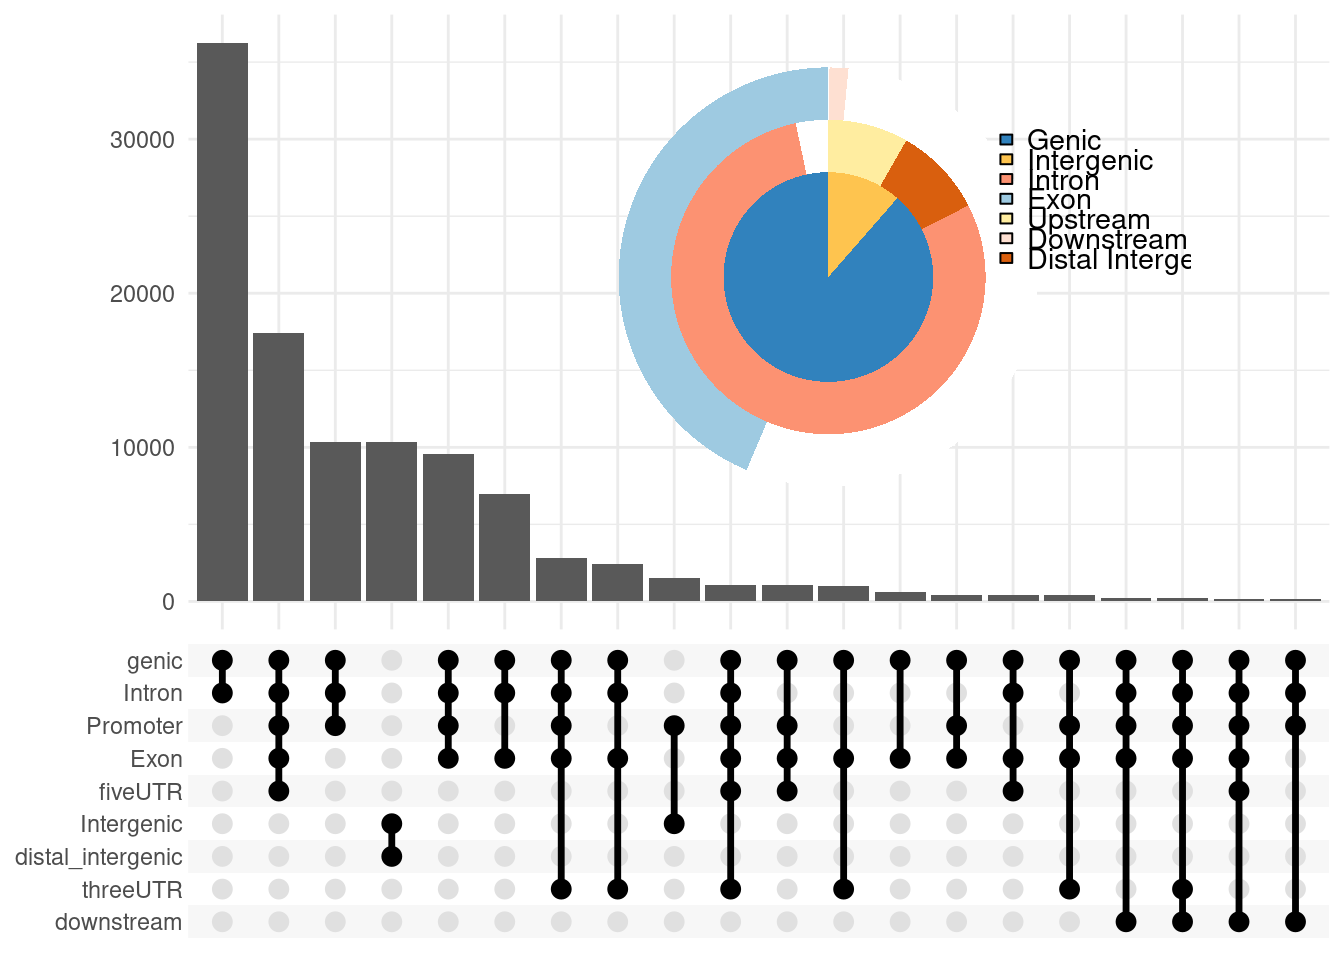
PASC
upsetplot(resultB$peakAnno1, vennpie = TRUE) 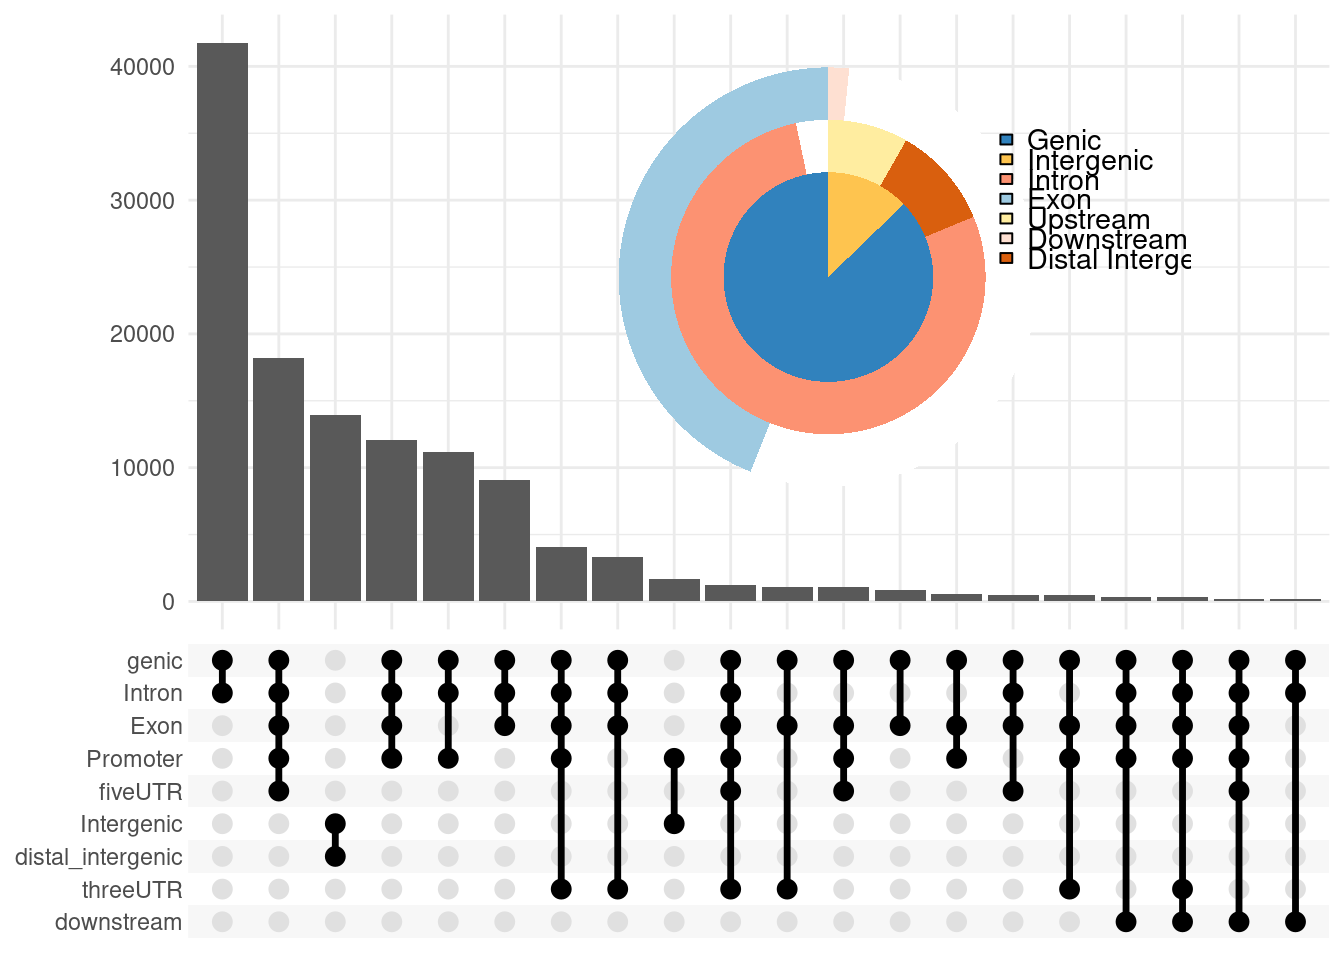
7.5 Sample C
resultC <- annotate_sample_peaks("Sample_C", "~/data/tasks/liam.kealy/processing/cellranger_SC_ATAC_covid_C")Healthy
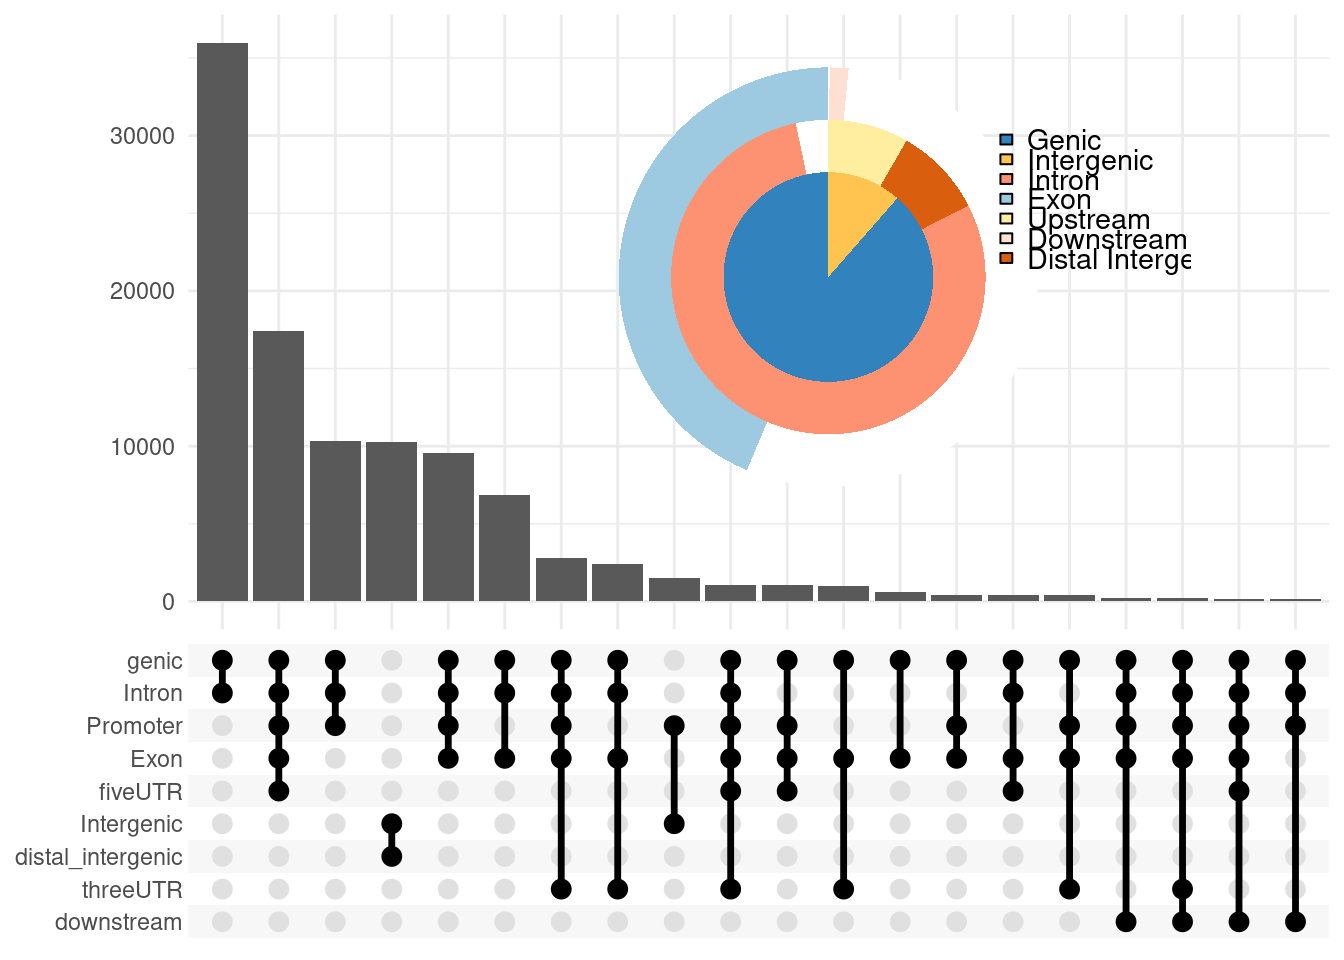
upsetplot(resultC$peakAnno1, vennpie = TRUE) 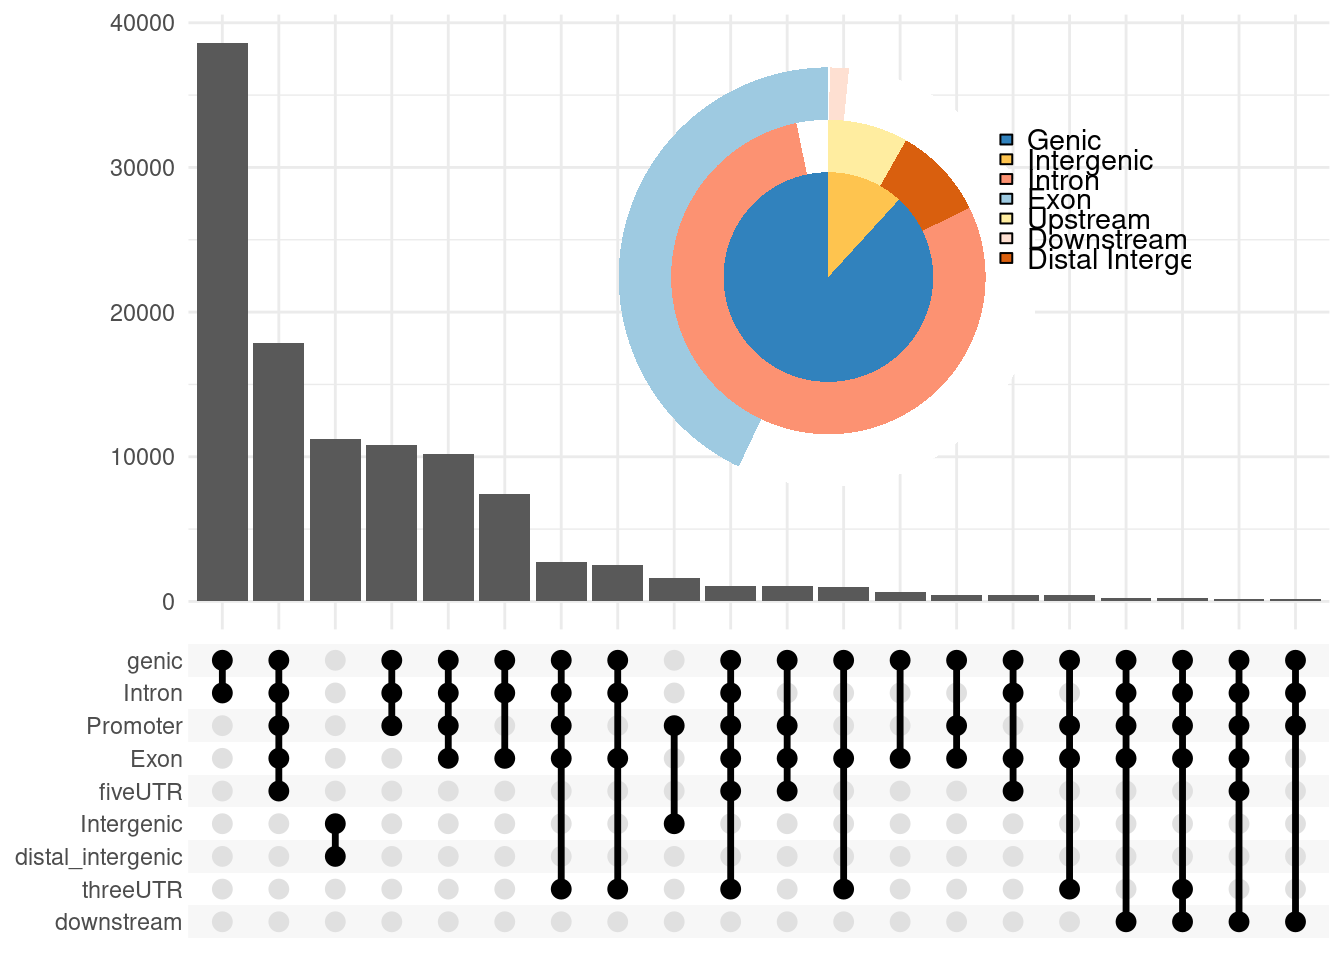
PASC
upsetplot(resultC$peakAnno2, vennpie = TRUE)