8 Merging Samples
8.1 Peak harmonisation and sample merging
Merge the three per-sample Seurat objects into a single combined object. Because each sample was processed independently by cellranger, the ATAC peak sets are not identical across samples. A harmonised consensus peak set is constructed by taking the union of all per-sample peaks, filtering out peaks that are unusually short (< 20 bp) or long (> 10 kb), and recomputing the feature matrix over this common peak set using the original fragment files. This ensures all samples are represented in the same peak space for downstream joint analysis.
# merge all datasets
combined <- merge(x = cntsB, y = list(cntsC, cntsD))
combined  <- JoinLayers(combined)

# build consensus peak set across all samples
peaks <- GenomicRanges::reduce(unlist(as(c(cntsB@assays$ATAC@ranges,
                                           cntsC@assays$ATAC@ranges,
                                           cntsD@assays$ATAC@ranges),
                                         "GRangesList")))

# filter peaks by width
peakwidths <- width(peaks)
peaks <- peaks[peakwidths < 10000 & peakwidths > 20]

# recount fragments over the consensus peaks
counts_atac_merged <- FeatureMatrix(combined@assays$ATAC@fragments,
                                    features = peaks,
                                    cells    = colnames(combined))

combined[['ATAC']] <- CreateChromatinAssay(counts_atac_merged,
                                            fragments  = combined@assays$ATAC@fragments,
                                            annotation = combined@assays$ATAC@annotation,
                                            sep        = c(":", "-"),
                                            genome     = "hg38")
8.2 QC metrics on the merged object
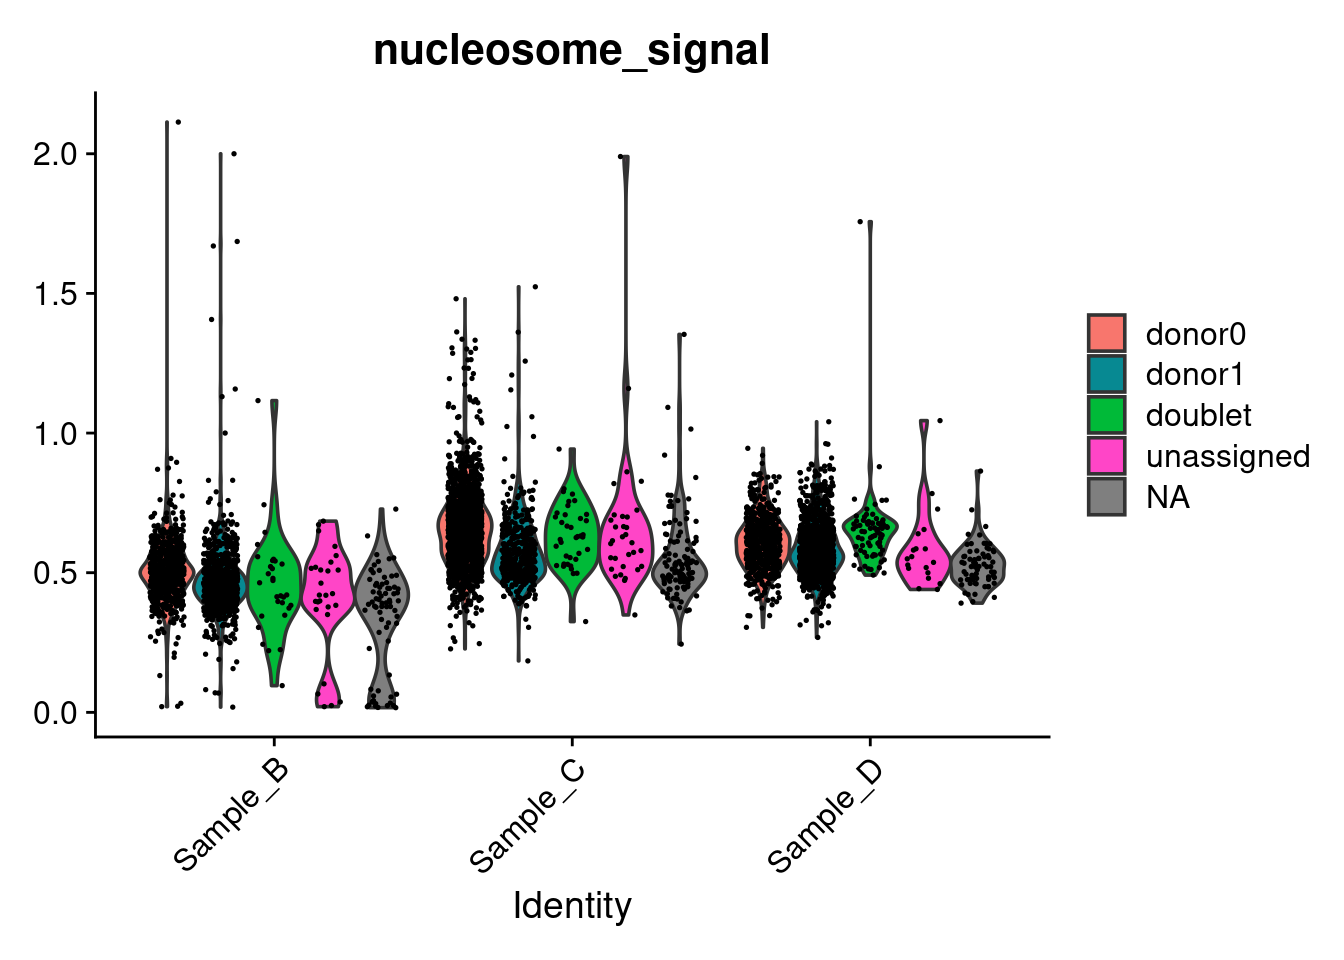
Recompute RNA and ATAC QC metrics on the merged object to confirm that the merging and peak recomputation did not introduce artefacts. Violin plots are split by donor within each sample to reveal any sample- or donor-specific quality differences at the combined level.
combined <- PercentageFeatureSet(combined, pattern = "^MT-", col.name = "percent.mt", assay = "RNA")
combined <- NucleosomeSignal(combined, assay = "ATAC")
combined <- TSSEnrichment(combined,    assay = "ATAC")
#> Processed 14571 groups out of 19947. 73% done. Time elapsed: 3s. ETA: 1s.Processed 19947 groups out of 19947. 100% done. Time elapsed: 3s. ETA: 0s.
VlnPlot(combined, features = "nFeature_RNA", pt.size = 0.1, group.by = 'sample', split.by = 'donor_id')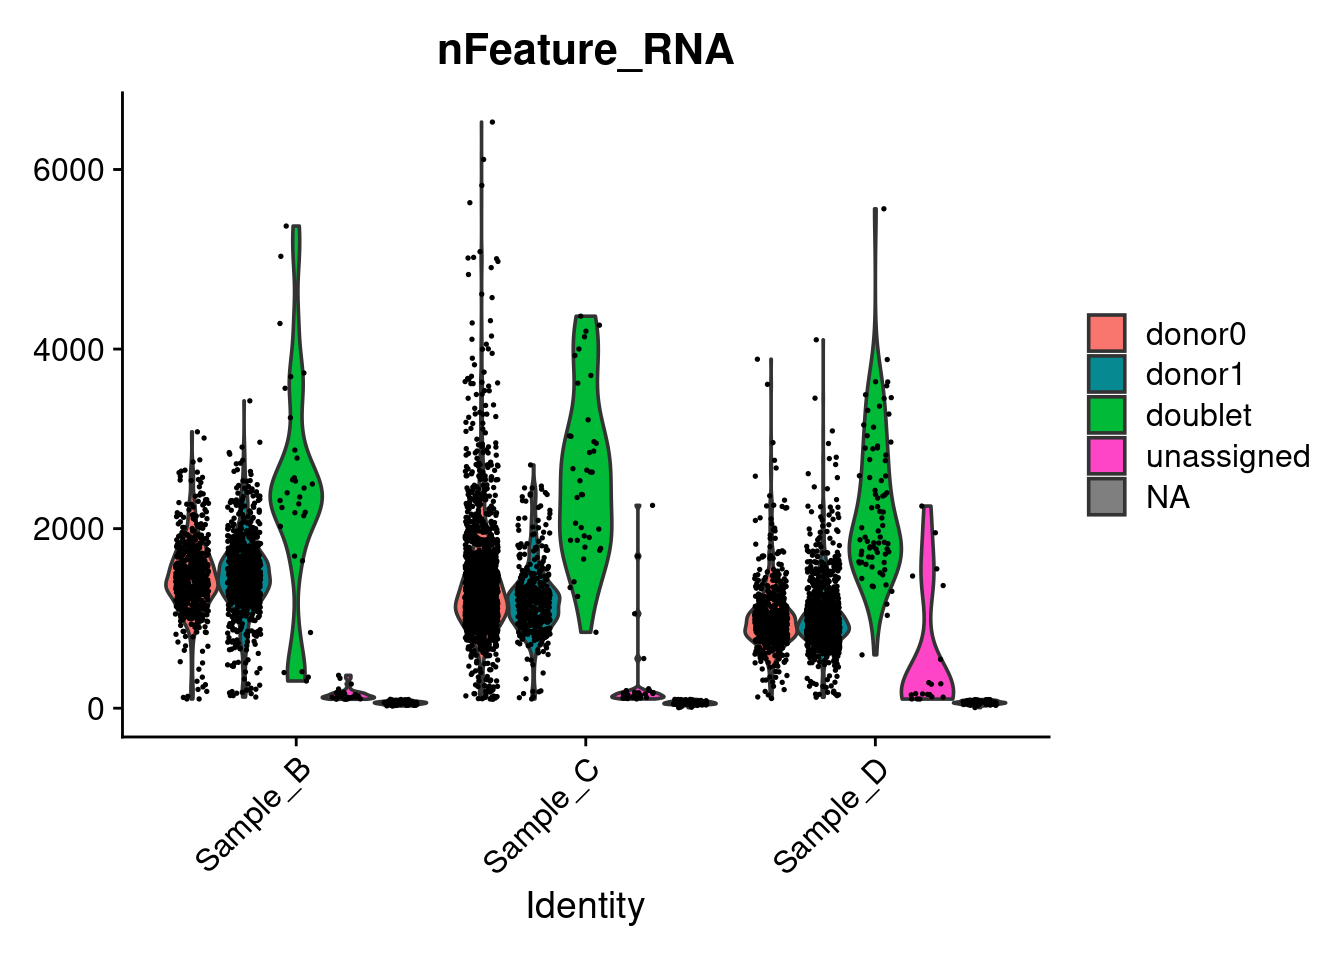
VlnPlot(combined, features = "nFeature_ATAC", pt.size = 0.1, group.by = 'sample', split.by = 'donor_id')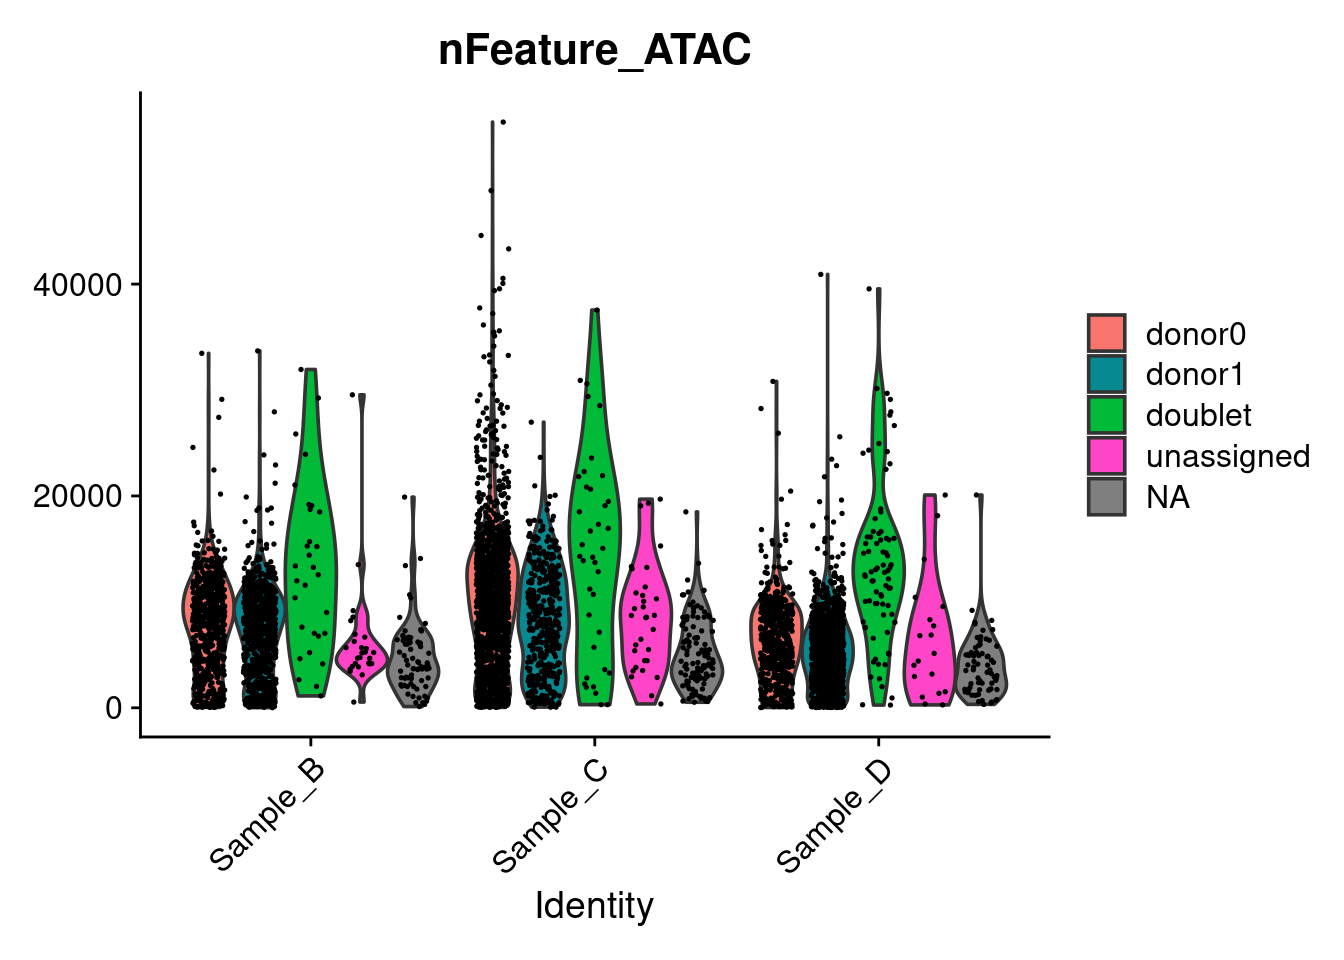
VlnPlot(combined, features = "nCount_RNA", pt.size = 0.1, group.by = 'sample', split.by = 'donor_id')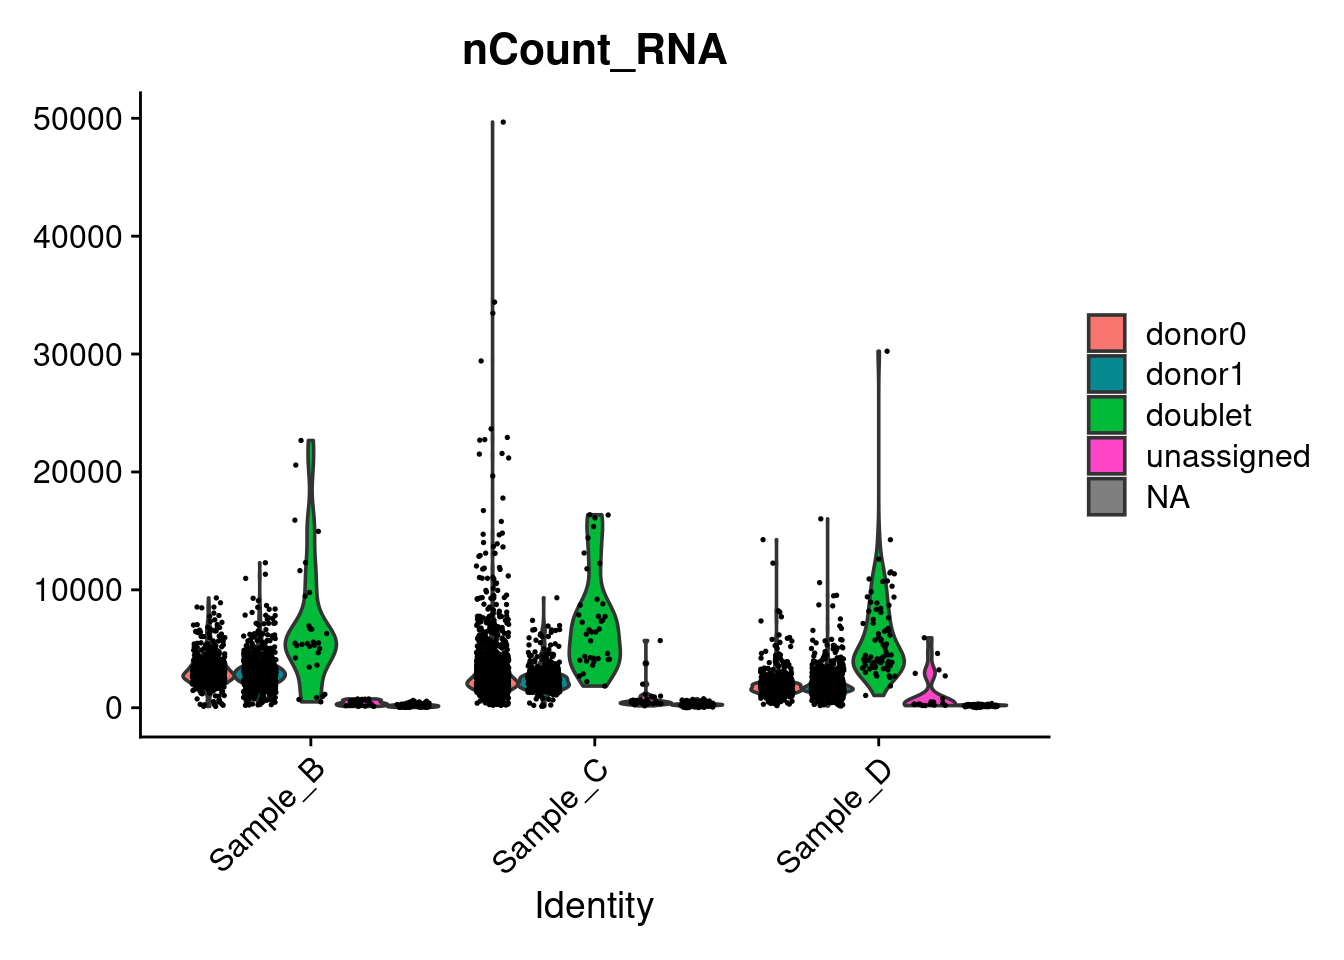
VlnPlot(combined, features = "nCount_ATAC", pt.size = 0.1, group.by = 'sample', split.by = 'donor_id')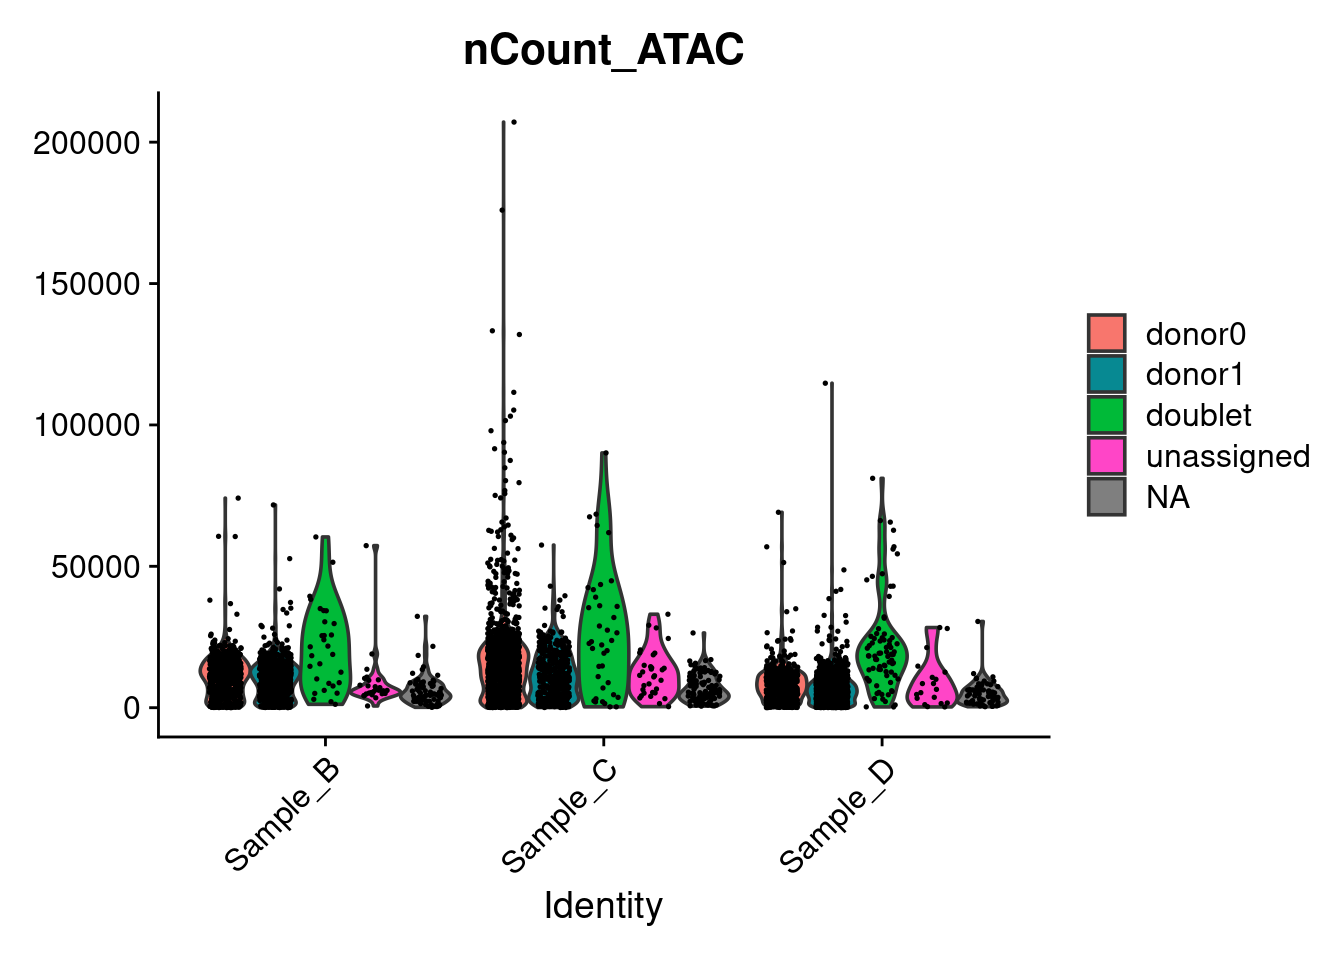
VlnPlot(combined, features = "percent.mt", pt.size = 0.1, group.by = 'sample', split.by = 'donor_id')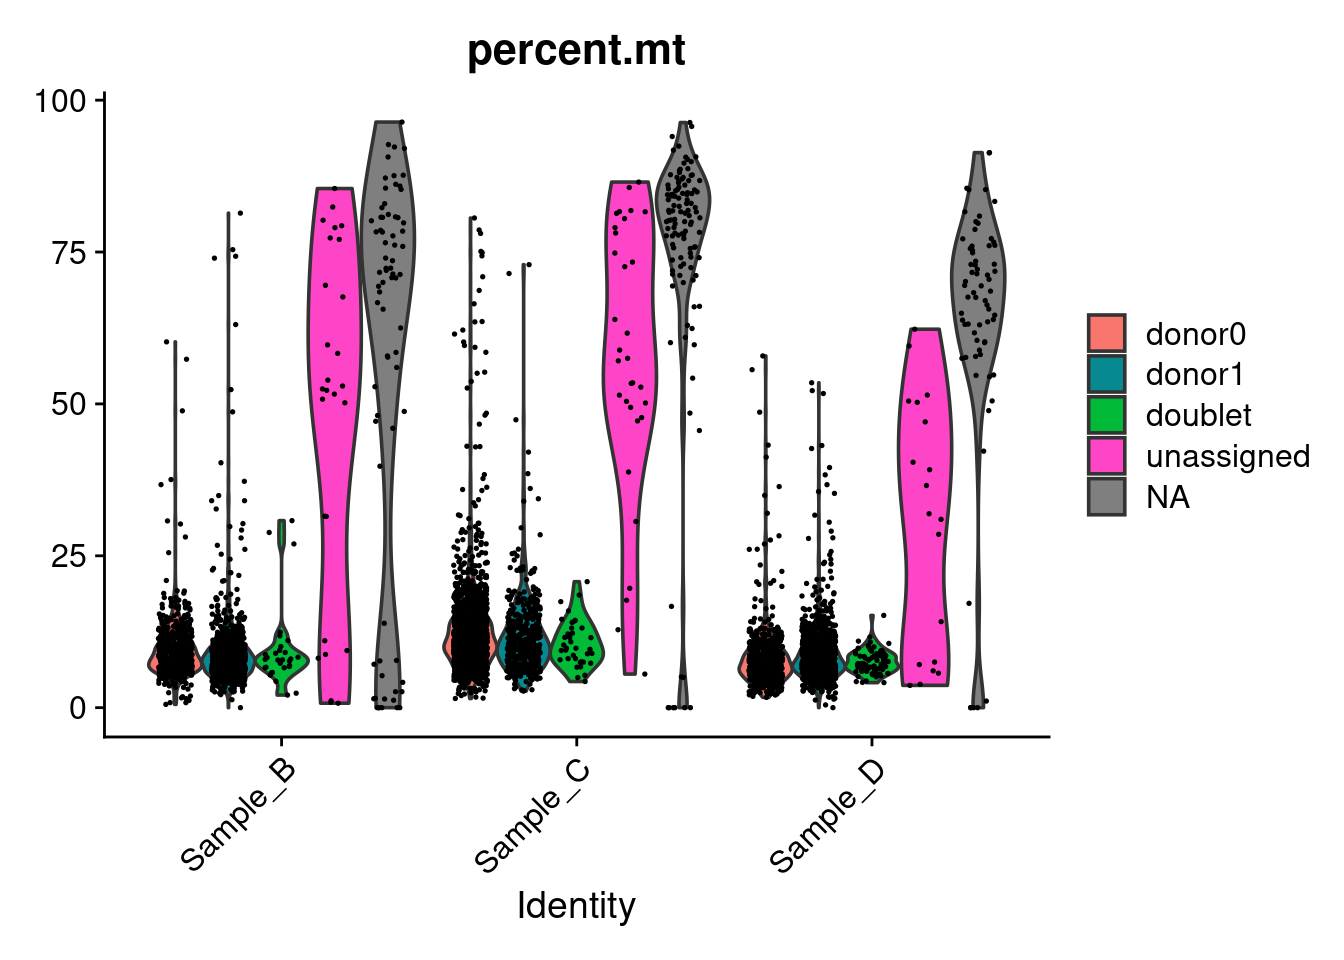
VlnPlot(combined, features = "TSS.enrichment", pt.size = 0.1, group.by = 'sample', split.by = 'donor_id')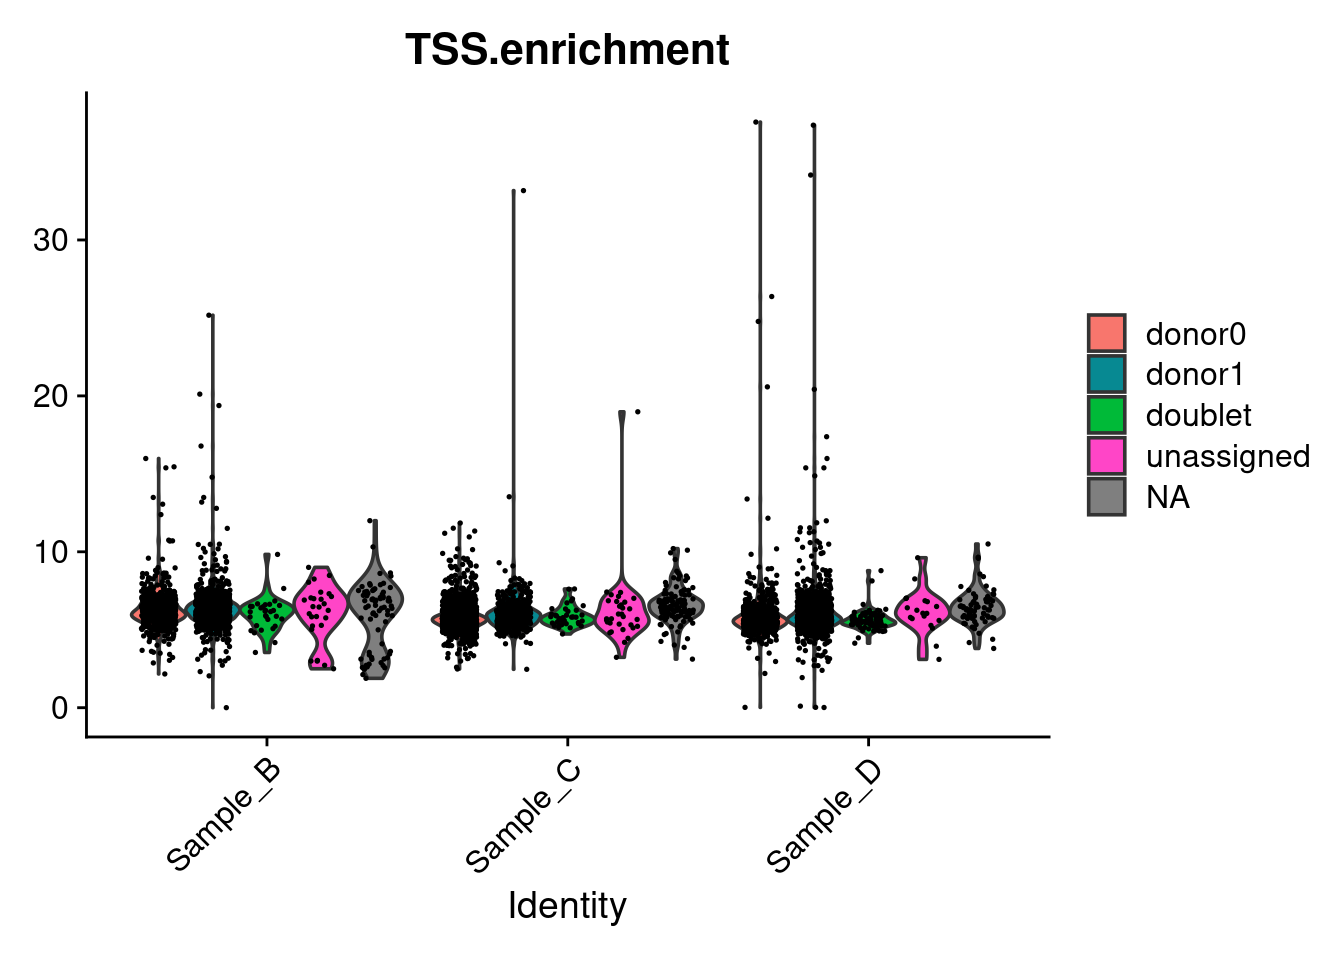
VlnPlot(combined, features = "nucleosome_signal", pt.size = 0.1, group.by = 'sample', split.by = 'donor_id')