27 Regulon Differential Expression per Cell Type
This chapter tests regulon activity (the regulon assay scored in the
Regulon Activity Scoring chapter) for differences between Healthy and PASC
cells, using two complementary tests: a per-cell Wilcoxon rank-sum test
(Seurat’s default FindMarkers test), shown for one example cell type, and
a pseudobulk test on sample/condition group means, inverse-variance-weighted
by their within-group variance and fit with limma, run across every cell
type to identify which regulons differ between conditions where. This
weighting scheme is different from the RNA pseudobulk approach in the
Pseudobulk Differential Expression chapter, which sums raw counts per group
and normalises with edgeR; here, group means of the (already continuous)
module-score data are averaged directly and down-weighted where
within-group variance is high, which suits the regulon assay’s activity
scores better than count-based normalisation (see that chapter’s
introduction for why edgeR is not used here).
The original analysis ((render_DEG_scMultiomics.R)[https://github.com/MonashBioinformaticsPlatform/SCmultiomics_longCOVID] and (DEG_scMultiomics.Rmd)[https://github.com/MonashBioinformaticsPlatform/SCmultiomics_longCOVID]) parameterised a report
over every cell type in cell_labels and rendered one HTML file per
cluster. That per-cluster loop lives outside a bookdown chapter (which
renders once); the same computation is instead run in a single loop below,
producing one combined results table across all cell types.
27.2 Per-cell Wilcoxon test (example cell type)
seurat_object_celltype <- combined[, combined$cell_labels == "cluster_0"]
Idents(seurat_object_celltype) <- seurat_object_celltype$individual_condition

de_result <- FindMarkers(seurat_object_celltype,
                         ident.1 = "Healthy",
                         ident.2 = "PASC",
                         logfc.threshold = 0,
                         min.pct = 0)

de_result$AveExpressionScoreRegulon <- rowMeans(
  GetAssayData(seurat_object_celltype, assay = "regulon", layer = "data")[rownames(de_result), ]
)

EnhancedVolcano(de_result,
               lab = rownames(de_result),
               x = "avg_log2FC",
               y = "p_val_adj", pCutoff = 0.01,
               xlab = "avg_log2FC", ylab = "-log10(adj.P.Val)")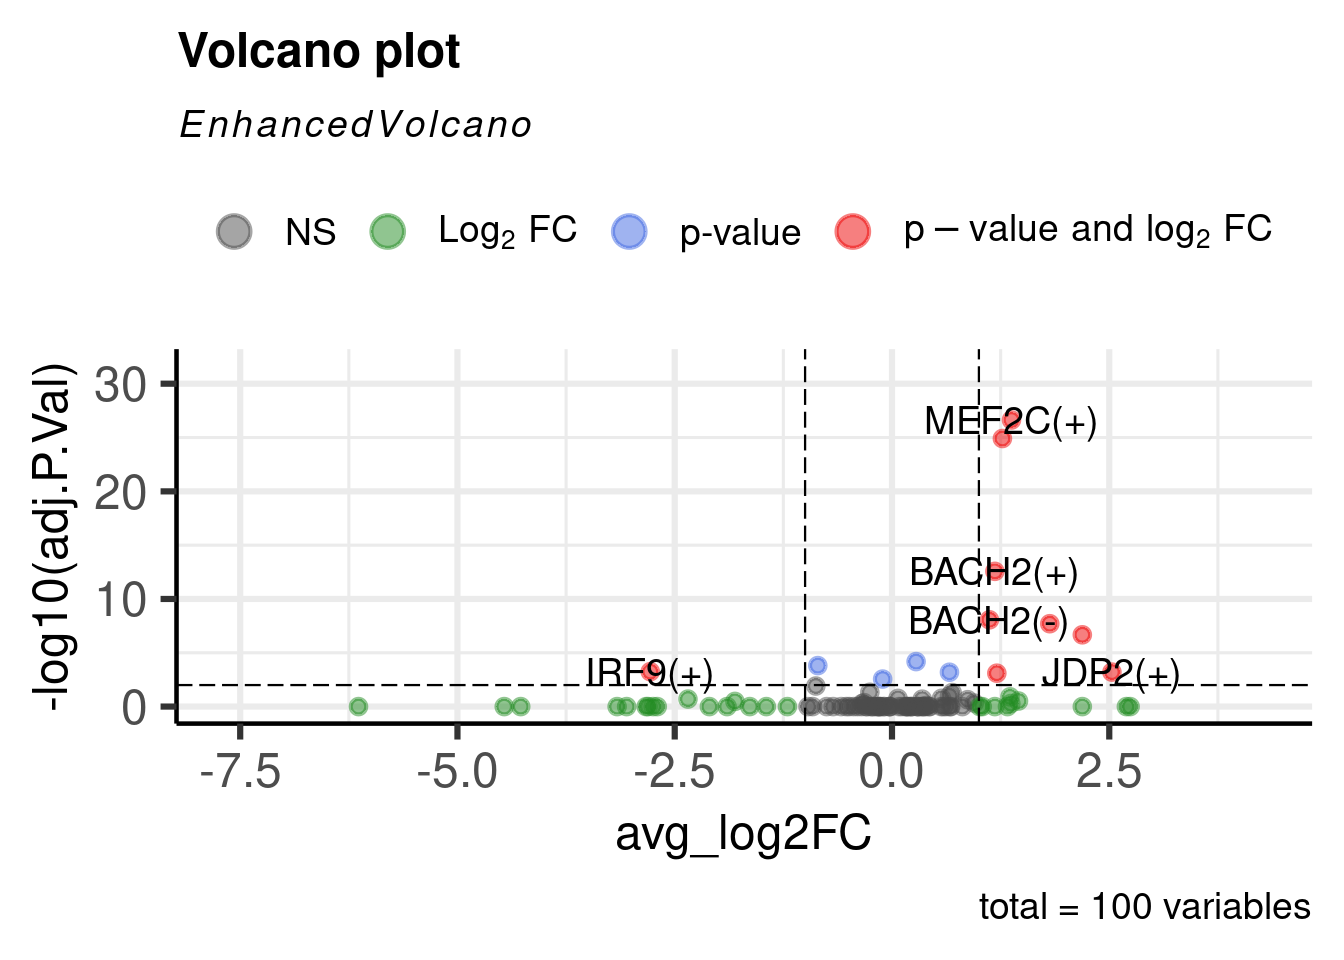
27.3 Variance-weighted pseudobulk test
Sample/condition groups with fewer than min_cells cells are dropped,
since a per-gene variance cannot be estimated from a single cell. Group
means are computed with slot = "counts" after aliasing the regulon
assay’s counts slot to its data slot — AverageExpression() otherwise
assumes counts holds raw counts and exponentiates data before
averaging, which is not meaningful for module-score activity values.
Condition (Healthy/PASC) is read directly off the end of each
sample_individual_condition group name (built as
paste0(sample, individual_condition) in the Peak-Gene Linking chapter),
rather than through a separate lookup table that would need to be kept in
sync with it — the original script’s lookup table used a dash
("Sample-BHealthy") that did not match the underscore actually produced
by paste0().
regulon_pseudobulk_de <- function(obj_ct, min_cells = 2) {
  Idents(obj_ct) <- obj_ct$sample_individual_condition
  cell_counts <- table(Idents(obj_ct))
  keep_groups <- names(cell_counts[cell_counts >= min_cells])
  if (length(keep_groups) < 2) return(NULL)
  obj_ct <- subset(obj_ct, idents = keep_groups)

  expression_matrix <- GetAssayData(obj_ct, assay = "regulon", layer = "data")
  metadata <- obj_ct@meta.data
  split_matrices <- split(colnames(expression_matrix), metadata$sample_individual_condition)
  groups <- names(split_matrices)

  # variance of the group mean = variance / n_cells; its inverse is the limma fit weight
  variance_list <- lapply(split_matrices, function(cells) {
    apply(expression_matrix[, cells, drop = FALSE], 1, var)
  })
  variance_matrix <- do.call(cbind, variance_list)
  colnames(variance_matrix) <- groups

  cell_counts_per_group <- table(metadata$sample_individual_condition)[groups]
  cell_counts_matrix <- t(replicate(nrow(expression_matrix), cell_counts_per_group))
  rownames(cell_counts_matrix) <- rownames(expression_matrix)
  colnames(cell_counts_matrix) <- groups

  weights_matrix <- 1 / (variance_matrix / cell_counts_matrix)

  obj_ct@assays$regulon$counts <- obj_ct@assays$regulon$data
  means_matrix <- AverageExpression(obj_ct, slot = "counts", assays = "regulon")[["regulon"]]

  condition <- factor(ifelse(grepl("Healthy$", colnames(means_matrix)), "Healthy", "PASC"),
                      levels = c("Healthy", "PASC"))
  if (length(unique(condition)) < 2) return(NULL)

  design <- model.matrix(~condition)
  fit <- lmFit(means_matrix, weights = weights_matrix, design = design)
  fit <- eBayes(fit, trend = TRUE)

  res <- topTable(fit, n = Inf, adjust.method = "BH")
  res <- arrange(res, adj.P.Val)
  res$AveExpressionScoreRegulon <- rowMeans(expression_matrix[rownames(res), ])
  res$regulon <- rownames(res)
  res
}
Applied to the same example cell type as the Wilcoxon test above:
de_result_pseudobulk <- regulon_pseudobulk_de(seurat_object_celltype)

EnhancedVolcano(de_result_pseudobulk,
               lab = de_result_pseudobulk$regulon,
               x = "logFC",
               y = "adj.P.Val", pCutoff = 0.05, FCcutoff = 0, drawConnectors = TRUE,
               xlab = "logFC of ModuleScore", ylab = "-log10(adj.P.Val)")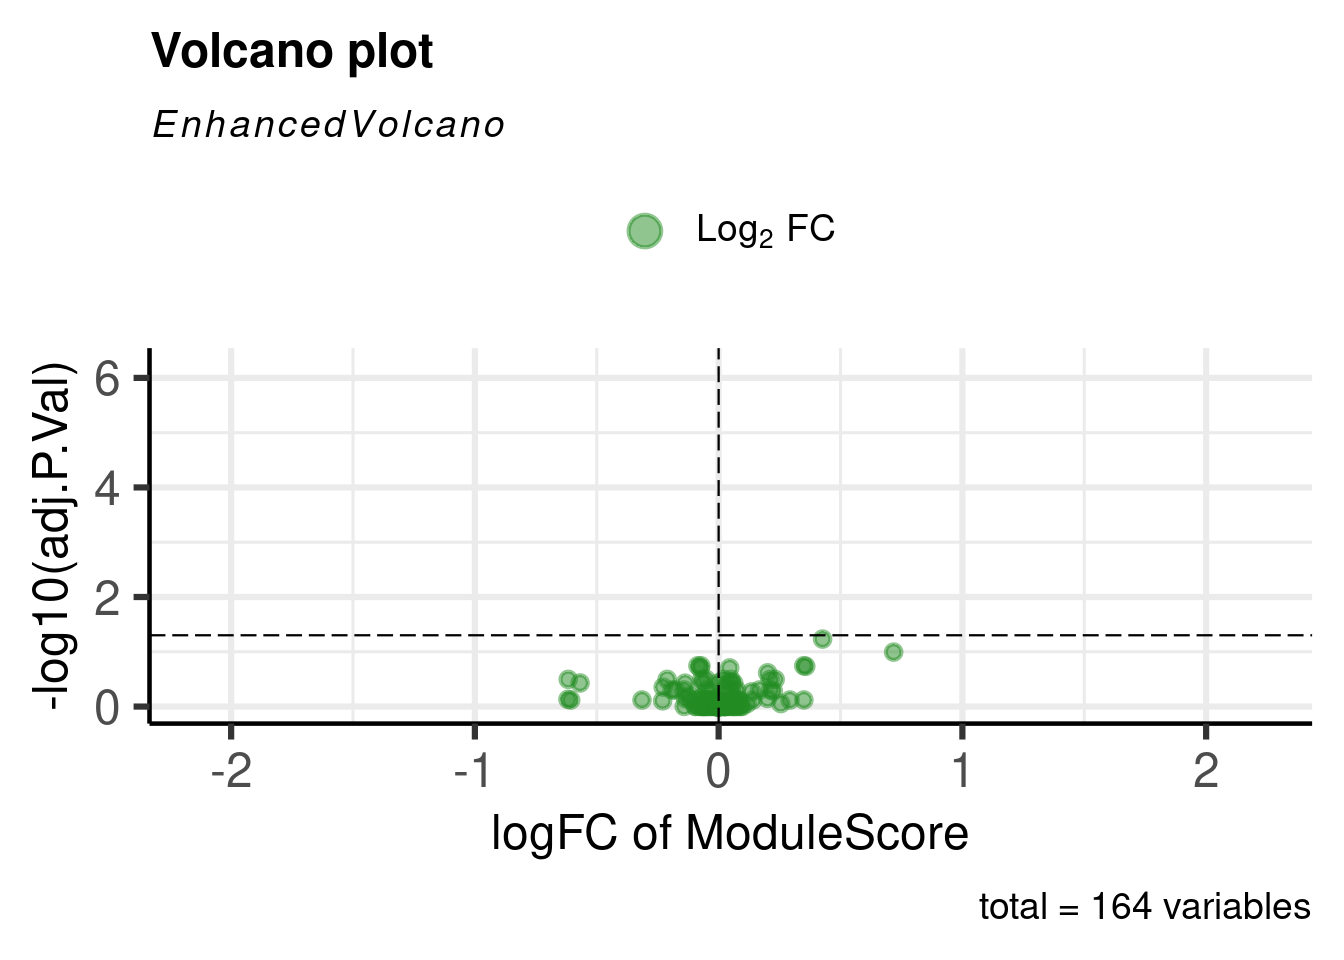
27.4 All cell types
The same test is run independently for every cell type, giving one combined
table of differentially active regulons tagged by cell_labels.
celltypes <- unique(combined$cell_labels)

regulon_de_per_celltype <- list()

for (ct in celltypes) {
  obj_ct <- combined[, combined$cell_labels == ct]
  res <- regulon_pseudobulk_de(obj_ct)
  if (is.null(res)) next
  res$cell_labels <- ct
  regulon_de_per_celltype[[ct]] <- res
}

regulon_de_per_celltype <- do.call(rbind, regulon_de_per_celltype)
27.5 Significant regulons and their targets
TF_regulation.txt (Regulon Activity Scoring chapter) links each regulon
name to its target genes; regulons below the adj.P.Val < 0.06 cutoff used
in the original analysis are cross-referenced against it here, across all
cell types.
TF_regulation <- read.table("data/TF_regulation.txt", header = TRUE)

top_regulons_per_celltype <- regulon_de_per_celltype %>%
  dplyr::filter(adj.P.Val < 0.06) %>%
  dplyr::select(cell_labels, regulon, logFC, adj.P.Val)

top_regulons_per_celltype %>%
  inner_join(TF_regulation, by = c("regulon" = "name")) %>%
  DT::datatable(extensions = "Buttons",
               options = list(dom = "Bfrtip", buttons = c("excel", "csv")))
27.6 Complete table of differentially expressed regulons
regulon_de_per_celltype %>%
  DT::datatable(extensions = "Buttons",
               options = list(dom = "Bfrtip", buttons = c("excel", "csv")))
write.table(regulon_de_per_celltype, "data/regulon_de_pseudobulk_per_celltype.txt", row.names = FALSE)