31 Trajectory Analysis (Slingshot)
Unlike Monocle3, which represents a single branching tree, Slingshot fits
one or more separate smooth lineages through the cluster structure, each
rooted at a common starting cluster. Multiple lineages indicate that the
data statistically supports more than one distinct path away from the
root — each should be checked against the underlying biology rather than
assumed to be meaningful. As in the Monocle3 chapter, the trajectory is
fit once on the full dataset and again separately on the PASC-only and
Healthy-only subsets, using cluster_6 as the root cluster in every case.
31.2 Fit and plot helpers
as.SingleCellExperiment() is followed by an explicit, name-based
reducedDim<- assignment rather than relying on whatever name Seurat’s SCE
coercion happens to give the embedding — the original script worked around
this uncertainty by referencing INTEGRATION.WNN, which does not match the
integration.wnn reduction actually computed in the Cross-modal Integration
chapter.
fit_slingshot <- function(obj, root_cluster = "cluster_6") {
  sce <- as.SingleCellExperiment(obj, assay = "RNA")
  reducedDim(sce, "integration.wnn") <- Embeddings(obj, "integration.wnn")

  slingshot(sce, clusterLabels = "cell_labels", reducedDim = "integration.wnn",
           dist.method = "slingshot", start.clus = root_cluster)
}

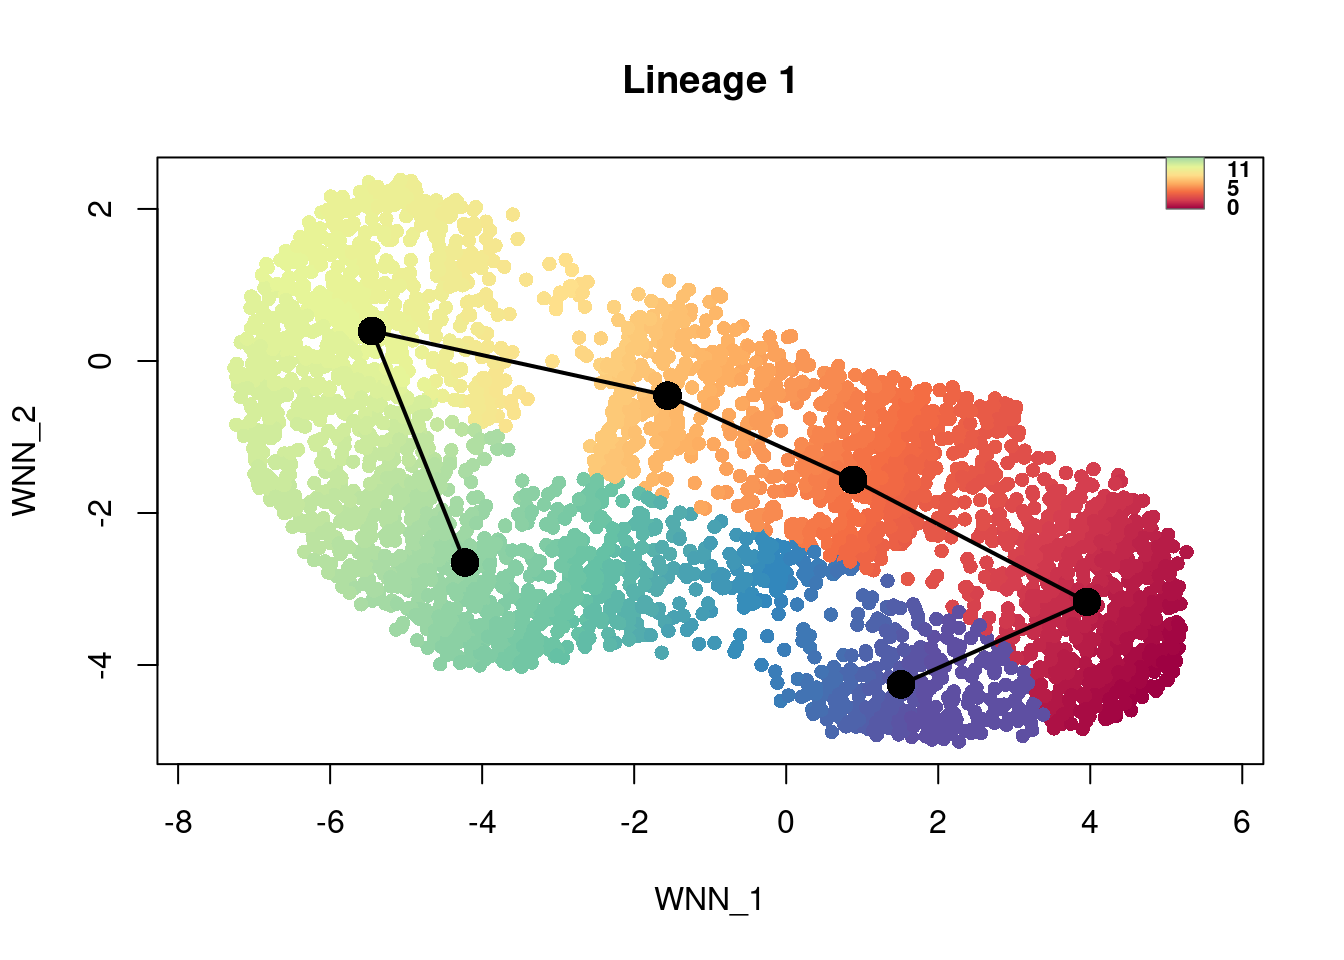
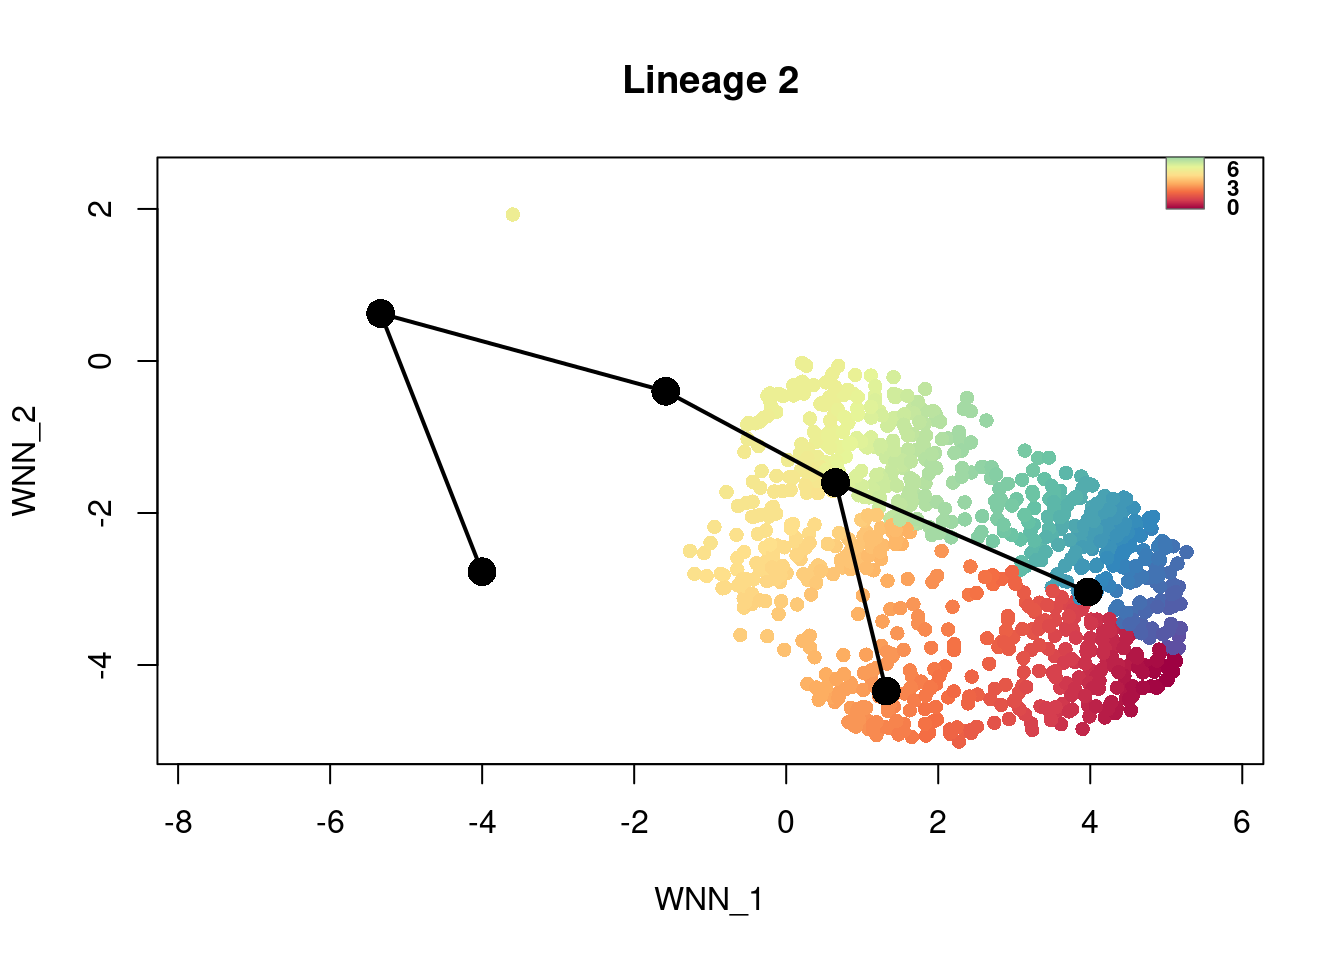
plot_lineage_pseudotime <- function(sce, pt, main = "") {
  colors <- colorRampPalette(brewer.pal(11, "Spectral")[-6])(100)
  plotcol <- colors[cut(pt, breaks = 100)]

  plot(reducedDim(sce, "integration.wnn"), col = plotcol, pch = 16, asp = 1, main = main)
  lines(SlingshotDataSet(sce), type = "l", lwd = 2, col = "black")

  legend_image <- as.raster(matrix(rev(colors), ncol = 1))
  rasterImage(legend_image, xleft = 5, ybottom = 2, xright = 5.5, ytop = 3)
  rect(5, 2, 5.5, 3, border = "grey40", lwd = 0.7)
  text(x = 5.55, y = seq(2, 3, length.out = 5),
      labels = round(quantile(pt, na.rm = TRUE), 0), cex = 0.7, pos = 4, col = "black", font = 2)
  text(x = 5.25, y = 3.3, labels = "Pseudotime", cex = 0.9, font = 2)
}

summarise_slingshot <- function(sce) {
  pt_all <- slingPseudotime(sce)

  for (i in seq_len(ncol(pt_all))) {
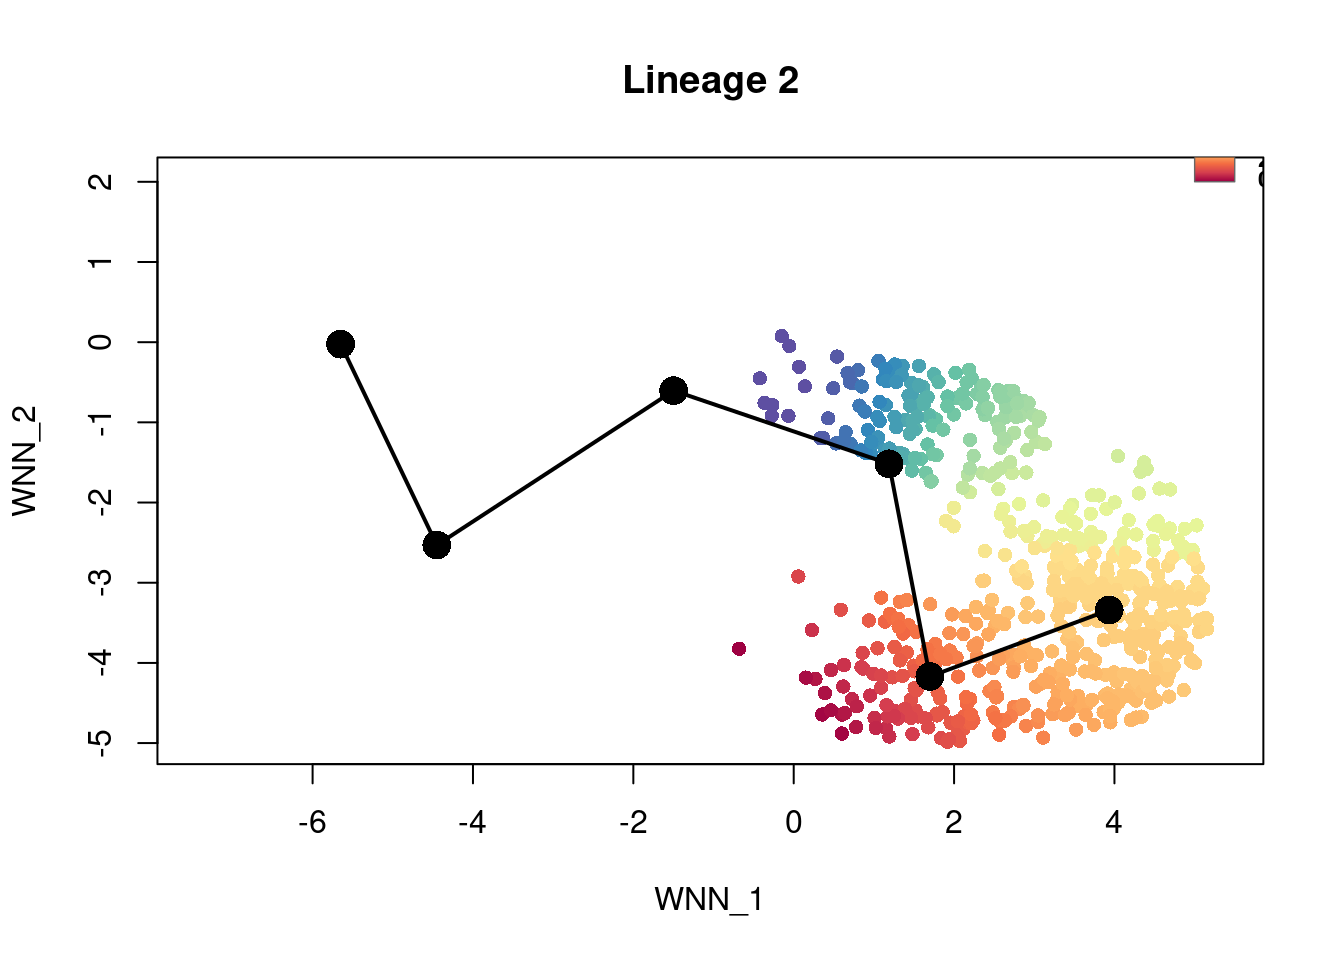
    plot_lineage_pseudotime(sce, pt_all[, i], main = paste("Lineage", i))
  }

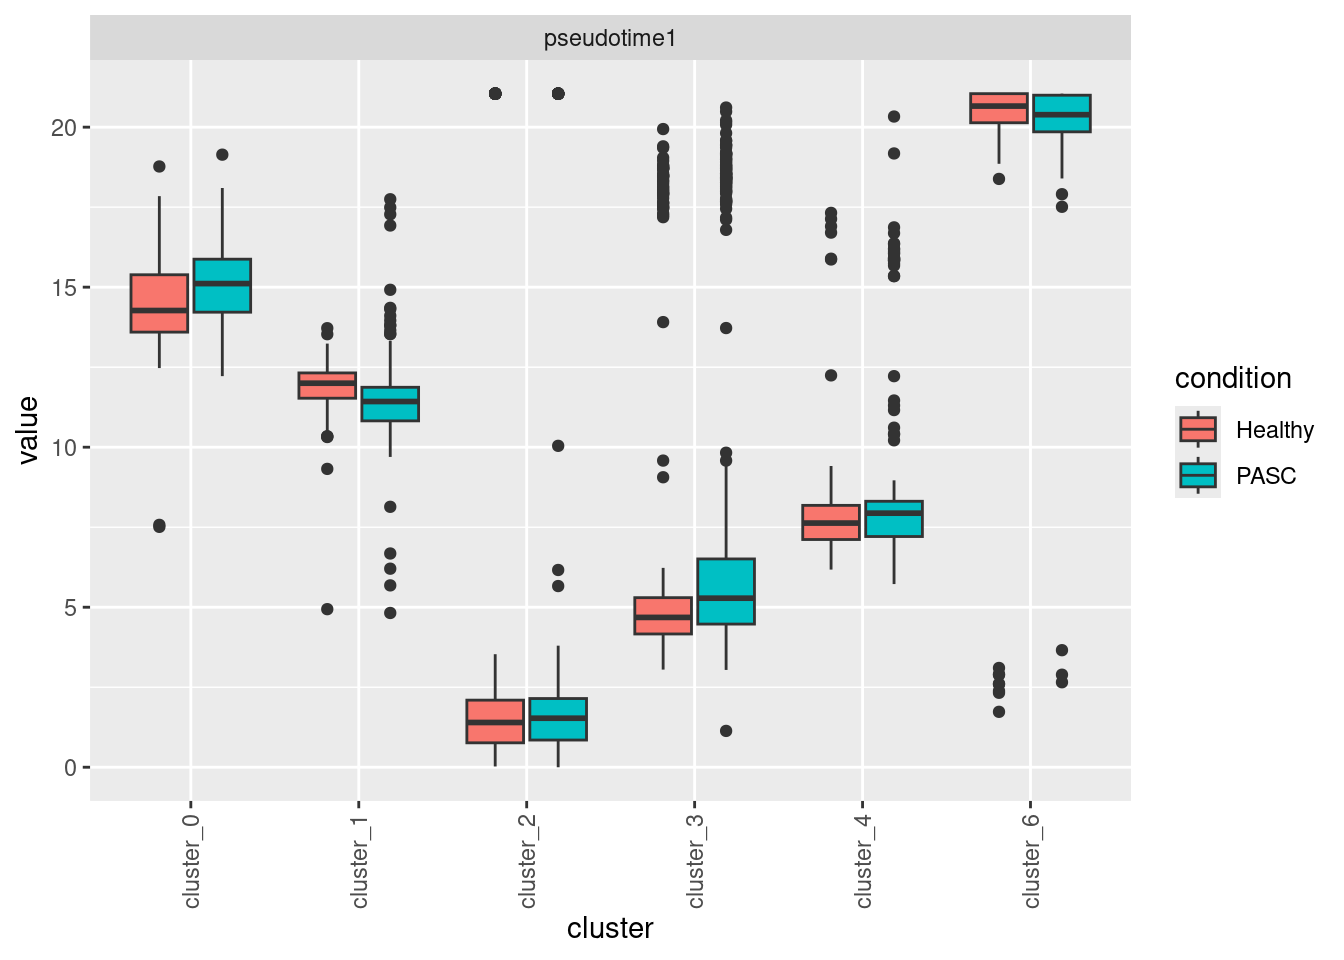
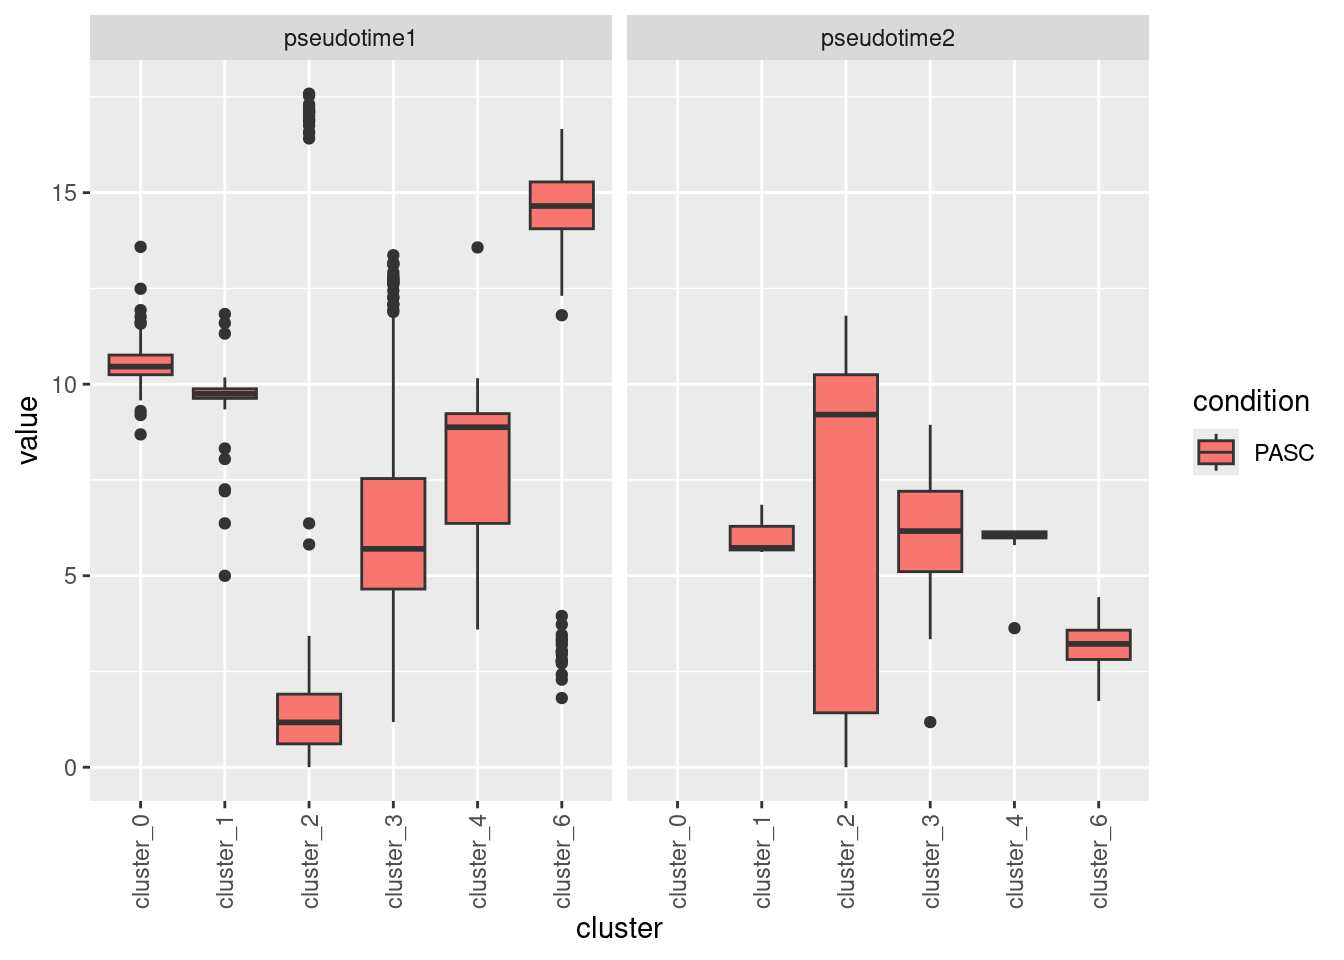
  df_long <- as.data.frame(pt_all)
  colnames(df_long) <- paste0("pseudotime", seq_len(ncol(pt_all)))
  df_long$cluster <- sce$cell_labels
  df_long$condition <- sce$individual_condition
  df <- melt(df_long, id = c("cluster", "condition"))

  print(
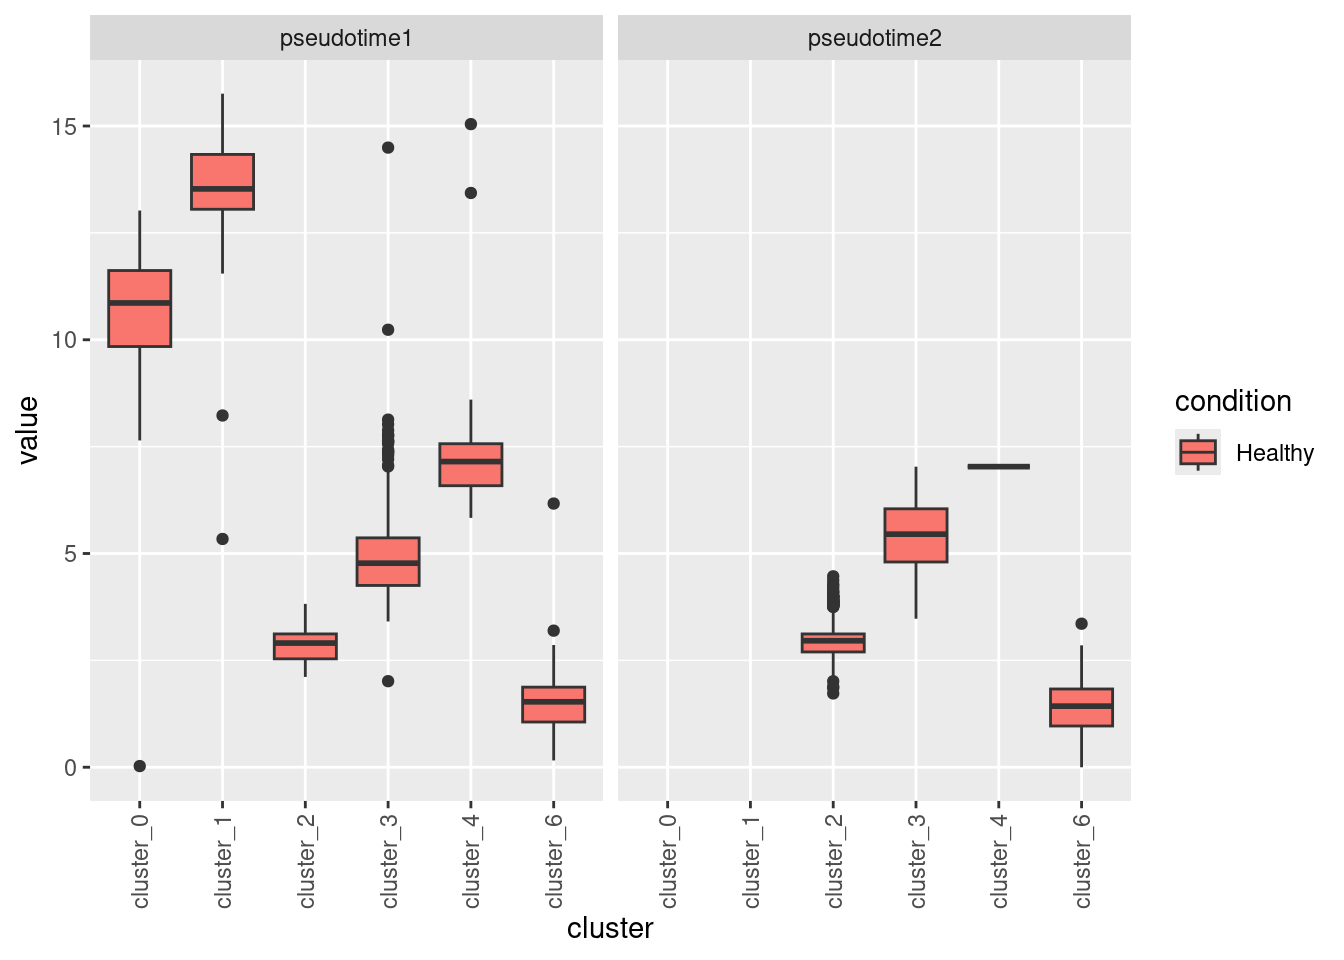
    ggplot(df, aes(y = value, x = cluster, fill = condition)) +
      geom_boxplot() +
      facet_grid(~variable) +
      theme(axis.text.x = element_text(angle = 90, vjust = 0.5, hjust = 1))
  )

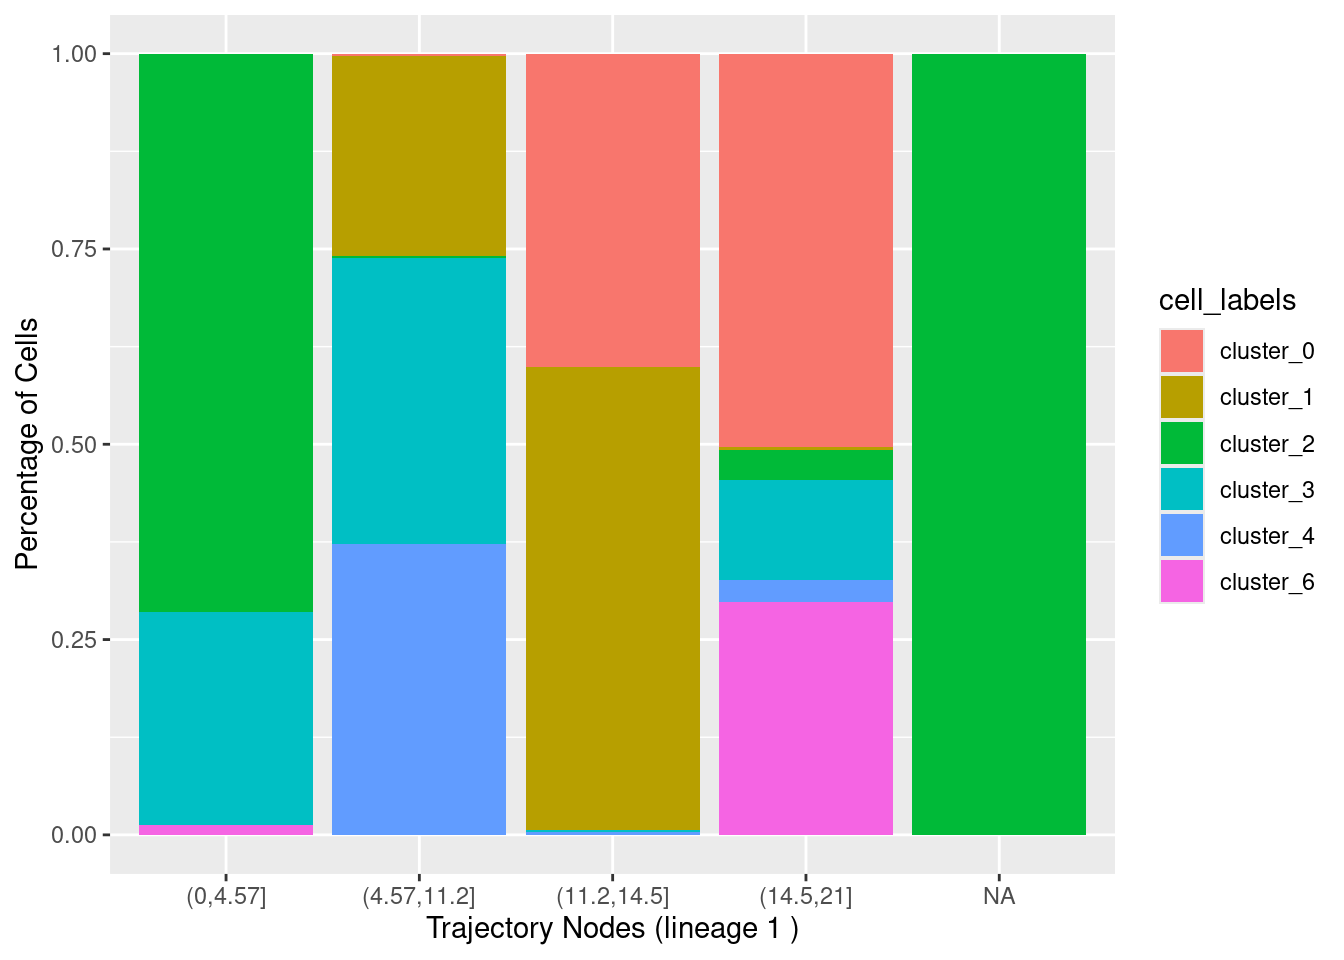
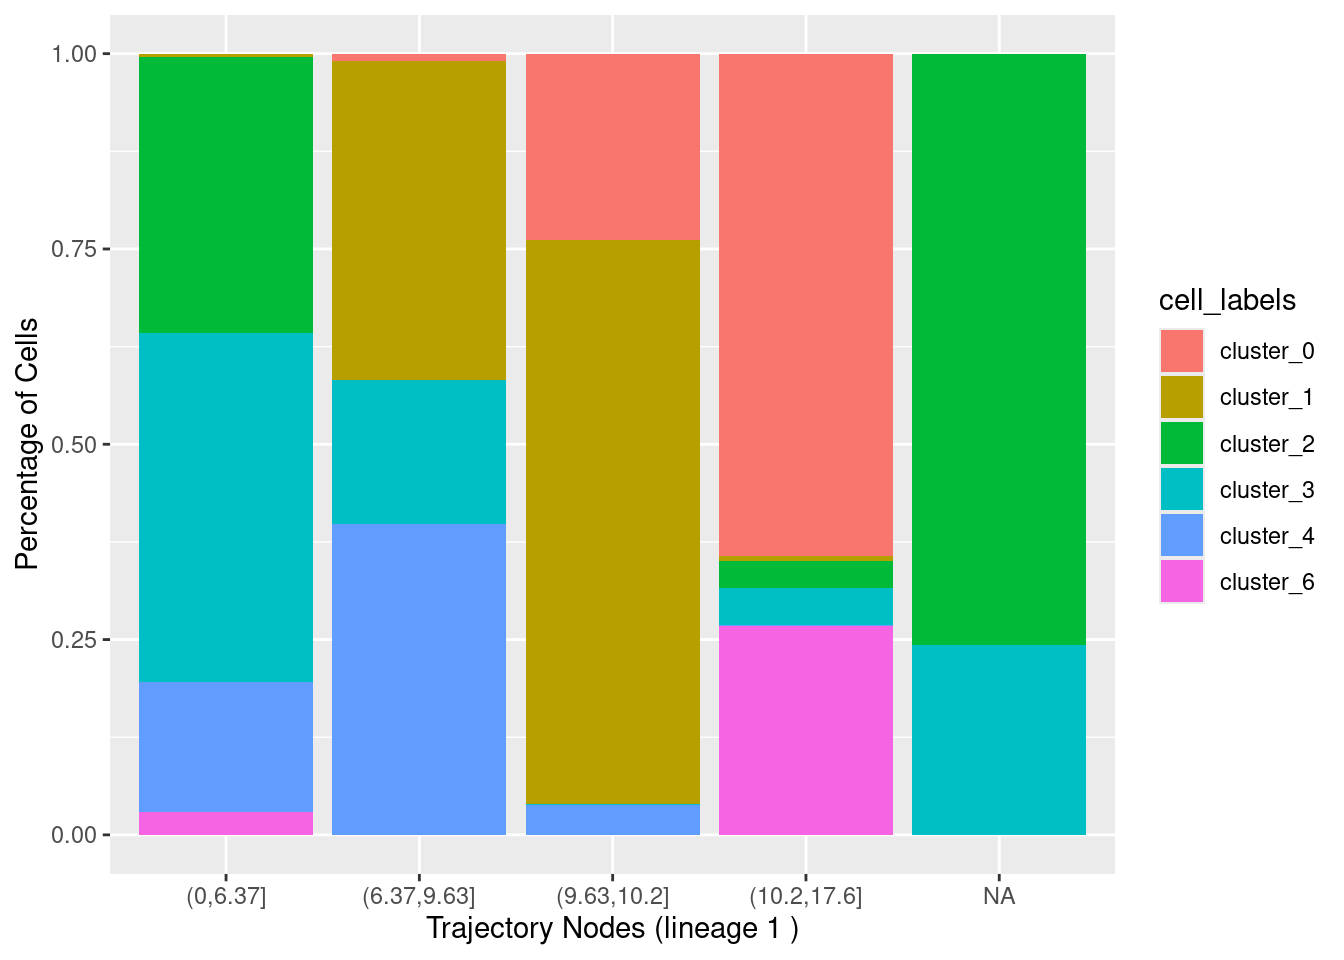
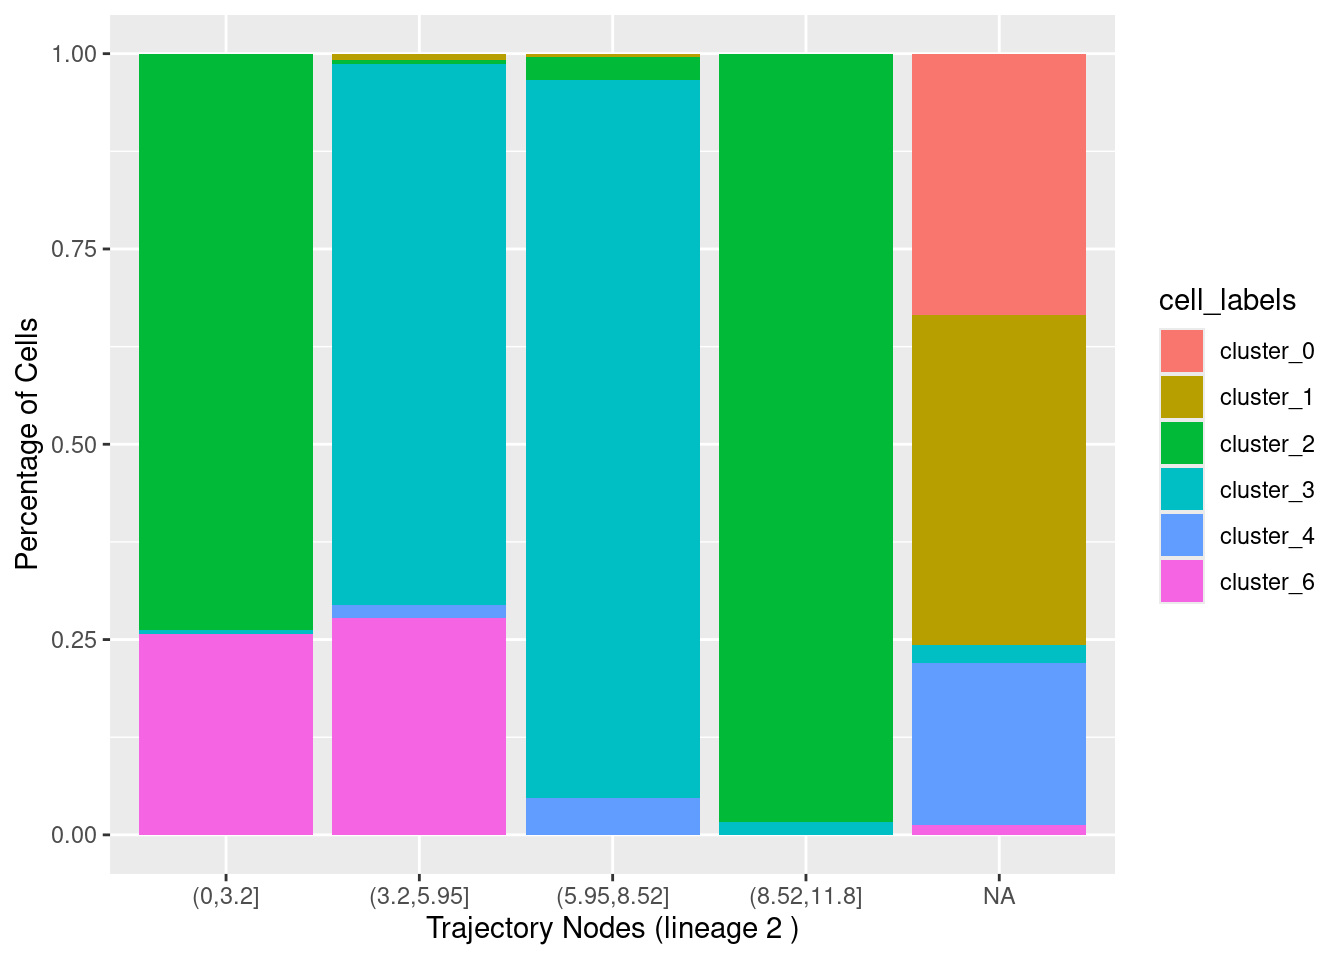
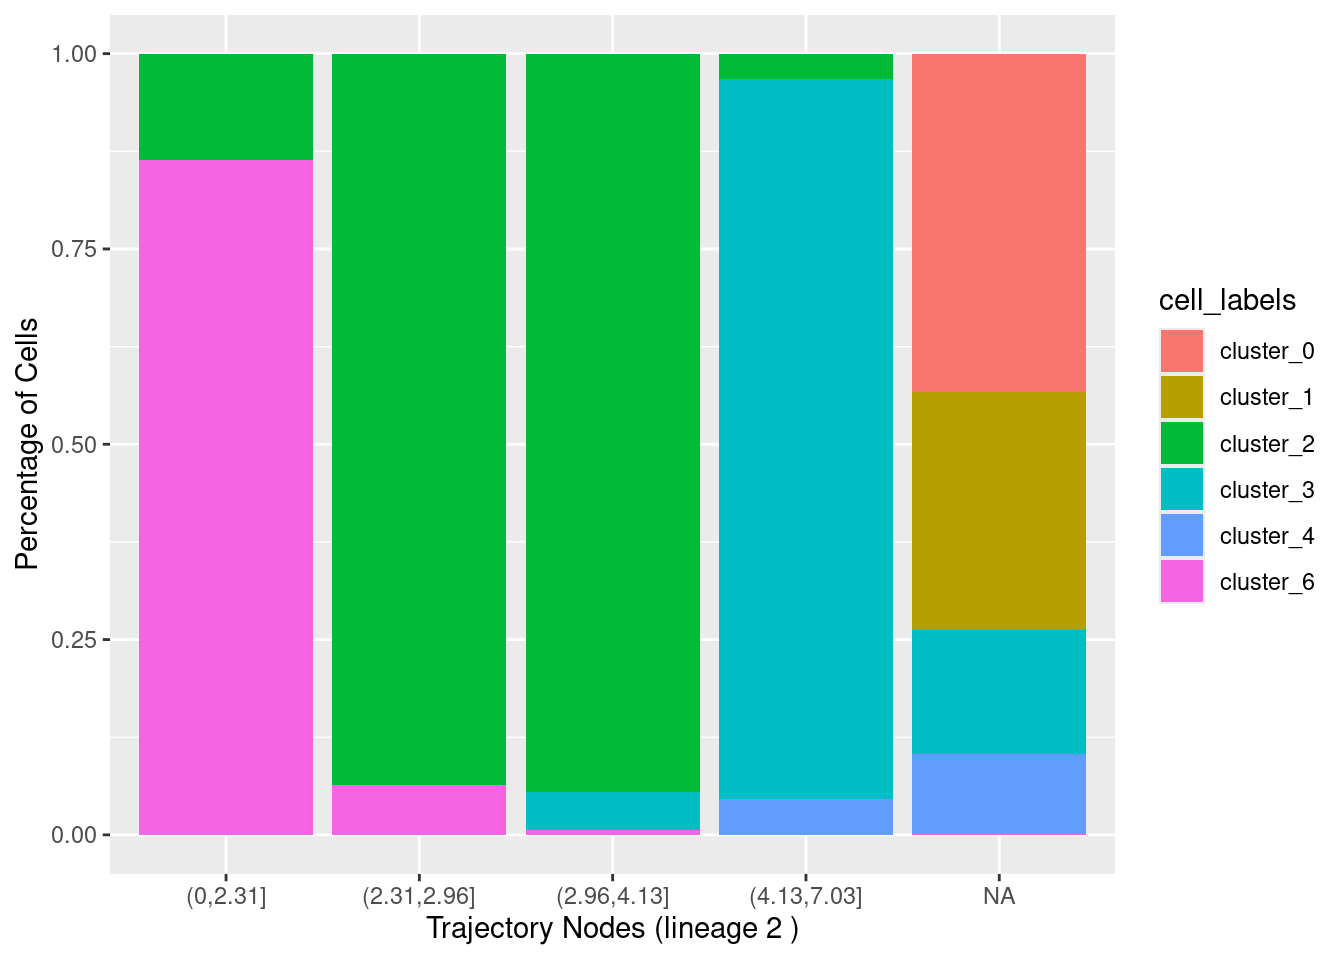
  for (i in seq_len(ncol(pt_all))) {
    breaks <- quantile(pt_all[, i], na.rm = TRUE)
    node <- cut(pt_all[, i], breaks, include.lowest = FALSE, right = TRUE, dig.lab = 3)

      count_node_df <- data.frame(node, cell_labels = sce$cell_labels,
                                  condition = sce$individual_condition) %>%
        dplyr::count(node, condition, cell_labels) %>%
        group_by(condition) %>%
        mutate(proportion = n / sum(n)) %>%
        ungroup()

    print(
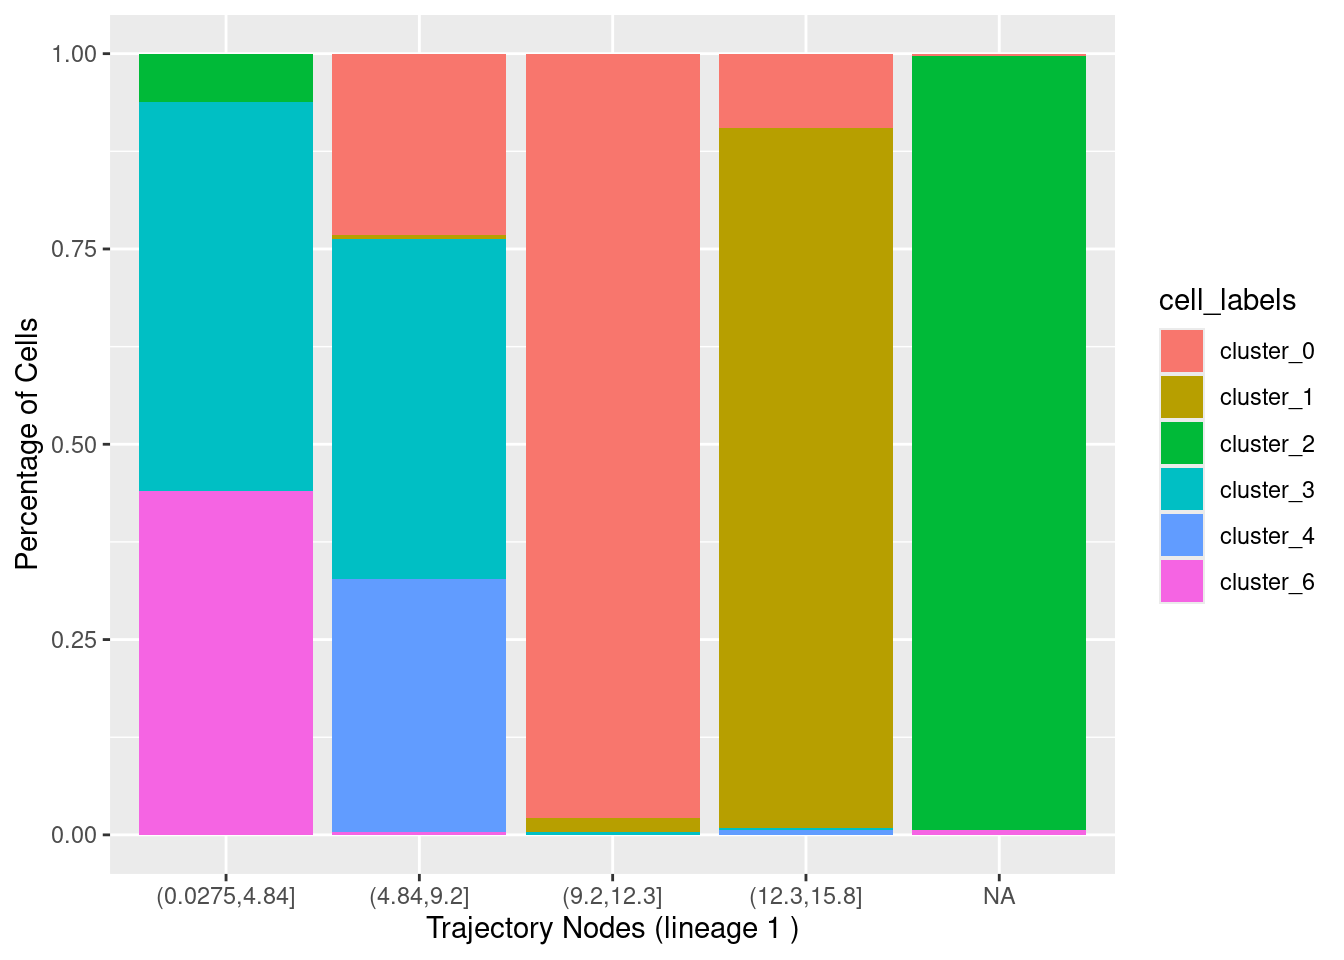
      ggplot(count_node_df, aes(y = proportion, x = node, fill = cell_labels)) +
        geom_bar(position = "fill", stat = "identity") +
        xlab(paste("Trajectory Nodes (lineage", i, ")")) + ylab("Percentage of Cells")
    )
  }
}
31.4 PASC only
sce_pasc <- fit_slingshot(combined[, combined$individual_condition == "PASC"])
summarise_slingshot(sce_pasc)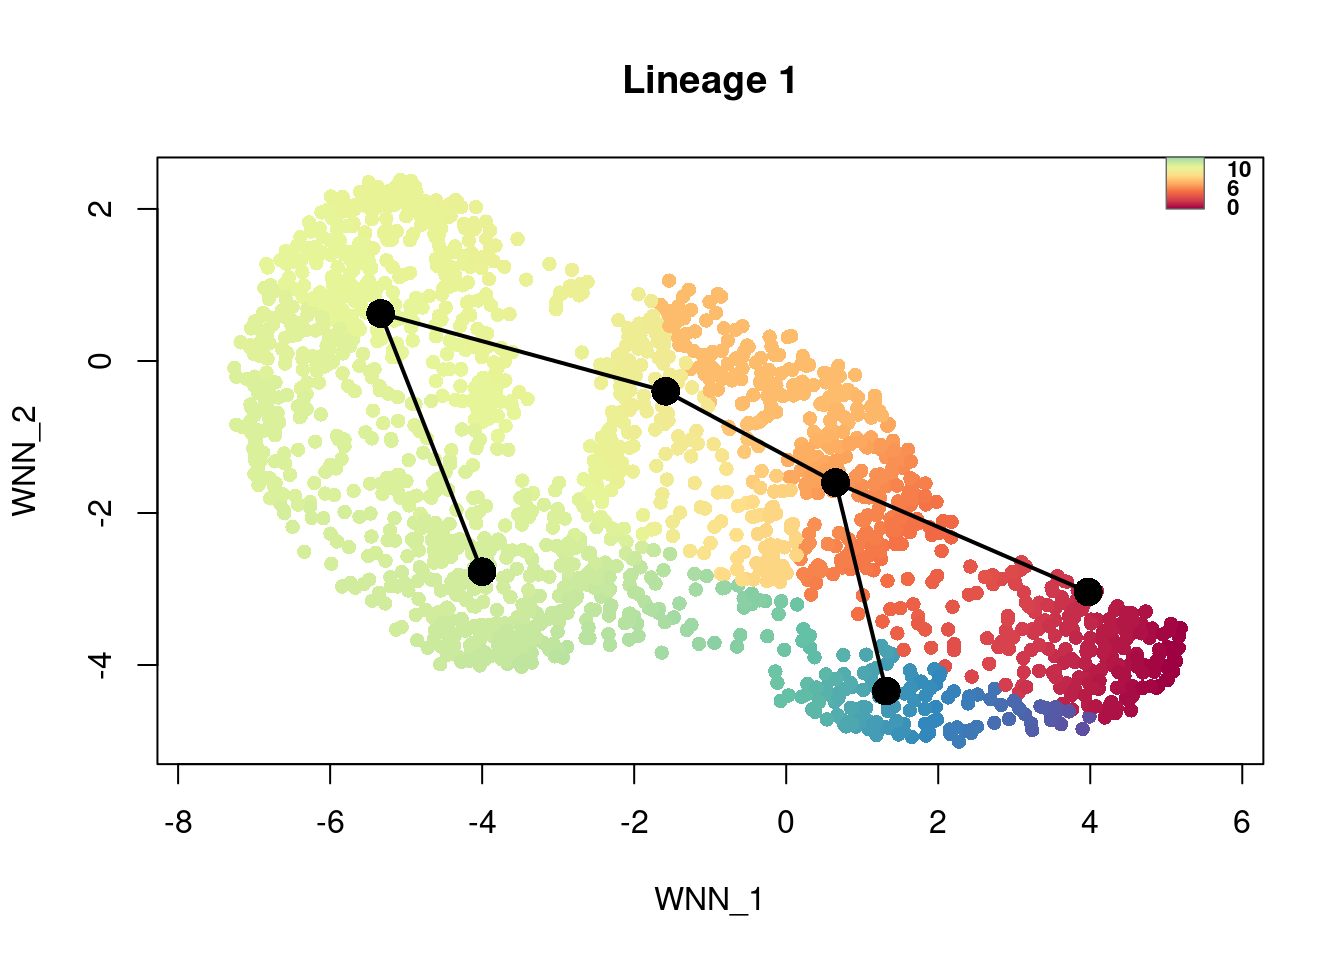
31.5 Healthy only
sce_healthy <- fit_slingshot(combined[, combined$individual_condition == "Healthy"])
summarise_slingshot(sce_healthy)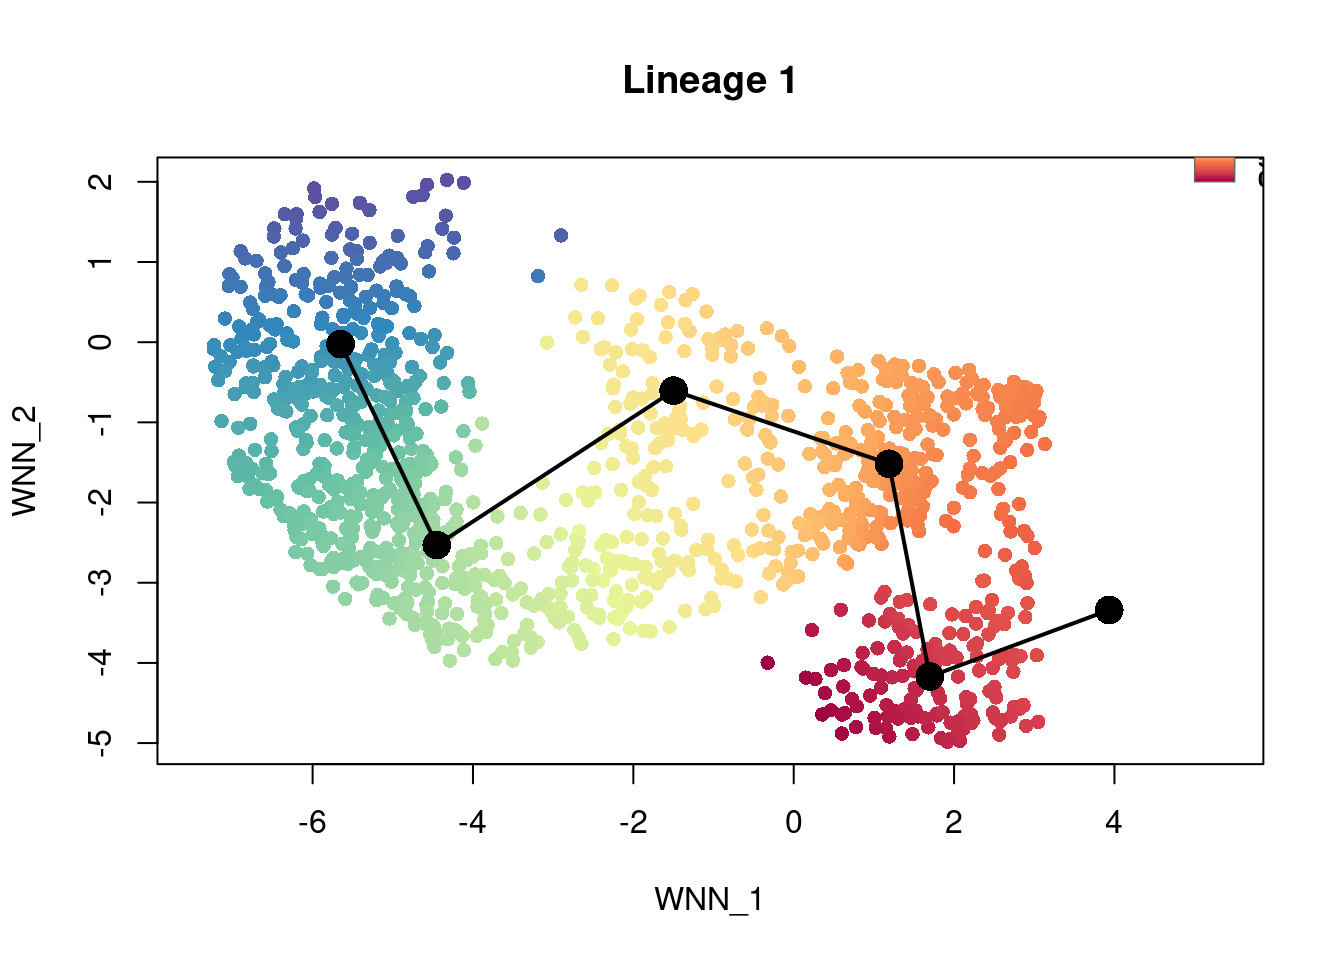
31.6 Genes changing along pseudotime (full dataset)
Testing every gene for association with pseudotime (tradeSeq::fitGAM /
associationTest) is computationally expensive, so this is eval=FALSE —
run manually when needed.
library(tradeSeq)

BiocParallel::register(BiocParallel::SerialParam())
combined <- FindVariableFeatures(combined)
counts <- as.matrix(GetAssayData(combined, assay = "RNA", layer = "counts")[Seurat::VariableFeatures(combined), ])
filt_counts <- counts[rowSums(counts > 5) > ncol(counts) / 100, ]

sce_genes <- fitGAM(counts = filt_counts, sds = SlingshotDataSet(sce_all))
associationRes <- associationTest(sce_genes)

pt <- slingPseudotime(sce_all)[, 1]
topgenes <- rownames(associationRes[order(associationRes$pvalue), ])[1:100]
pst.ord <- order(pt, na.last = NA)
heatdata <- assays(sce_genes)$counts[topgenes, pst.ord]
heatclus <- sce_genes$cell_labels[pst.ord]

heatmap(log1p(as.matrix(heatdata)),
       Colv = NA,
       ColSideColors = brewer.pal(9, "Set1")[as.numeric(factor(heatclus))])
31.7 Export trajectory graph for ShinyCellModular
combined@misc$trajectory_graph already holds the Monocle3 entries from the
previous chapter’s save, since combined here was reloaded from that file.
This step appends the Slingshot lineage curves rather than replacing them,
one entry per fitted lineage per condition.
# reshape a fitted slingshot curve into consecutive source/target segments,
# for plotting only, no recalculation. reads the curve slingshot() already fit
extract_slingshot_curve <- function(cv) {
  coords <- as.data.frame(cv$s[cv$ord, , drop = FALSE])
  ndim <- ncol(coords)
  colnames(coords) <- c("x", "y", "z")[seq_len(ndim)]
  n <- nrow(coords)
  edges <- data.frame(
    x_source = coords[-n, "x"], y_source = coords[-n, "y"],
    x_target = coords[-1, "x"], y_target = coords[-1, "y"]
  )
  if (ndim == 3) {
    edges$z_source <- coords[-n, "z"]
    edges$z_target <- coords[-1, "z"]
  }
  edges
}

# one graph entry per lineage, since a single sce can hold several
export_slingshot_lineages <- function(sce, name) {
  curves <- slingshot::slingCurves(slingshot::SlingshotDataSet(sce))
  setNames(
    lapply(curves, function(cv) list(dim2 = extract_slingshot_curve(cv), dim3 = NULL)),
    paste0(name, "_", seq_along(curves))
  )
}


combined@misc$trajectory_graph <- c(
  combined@misc$trajectory_graph,
  export_slingshot_lineages(sce_all,     "slingshot_pseudotime_all"),
  export_slingshot_lineages(sce_pasc,    "slingshot_pseudotime_pasc"),
  export_slingshot_lineages(sce_healthy, "slingshot_pseudotime_healthy")
)
31.8 Save results
# Add full-dataset pseudotime back onto the Seurat object as metadata columns.
# Only sce_all shares combined's full set of cells; sce_pasc/sce_healthy are
# subsets, so their pseudotime is added only for the cells they contain.
pt_all <- as.data.frame(slingPseudotime(sce_all))
colnames(pt_all) <- paste0("slingshot_pseudotime_all_", seq_len(ncol(pt_all)))
combined <- AddMetaData(combined, pt_all[colnames(combined), , drop = FALSE])

pt_pasc <- as.data.frame(slingPseudotime(sce_pasc))
colnames(pt_pasc) <- paste0("slingshot_pseudotime_pasc_", seq_len(ncol(pt_pasc)))
combined <- AddMetaData(combined, pt_pasc)

pt_healthy <- as.data.frame(slingPseudotime(sce_healthy))
colnames(pt_healthy) <- paste0("slingshot_pseudotime_healthy_", seq_len(ncol(pt_healthy)))
combined <- AddMetaData(combined, pt_healthy)

# Seurat metadata only holds pseudotime values, not the fitted curves,
# lineage tree, or per-lineage weights, so keep the SCE objects as well.
saveRDS(sce_all, "data/sce_slingshot_all.rds")
saveRDS(sce_pasc, "data/sce_slingshot_pasc.rds")
saveRDS(sce_healthy, "data/sce_slingshot_healthy.rds")

SaveSeuratRds(combined, "data/seurat_object_cross_modal_integration_peakslinks_motifs_grn_regulons_monoclepseudotime_slingshot.rds")