29 TF Regulatory Subnetwork Diagrams
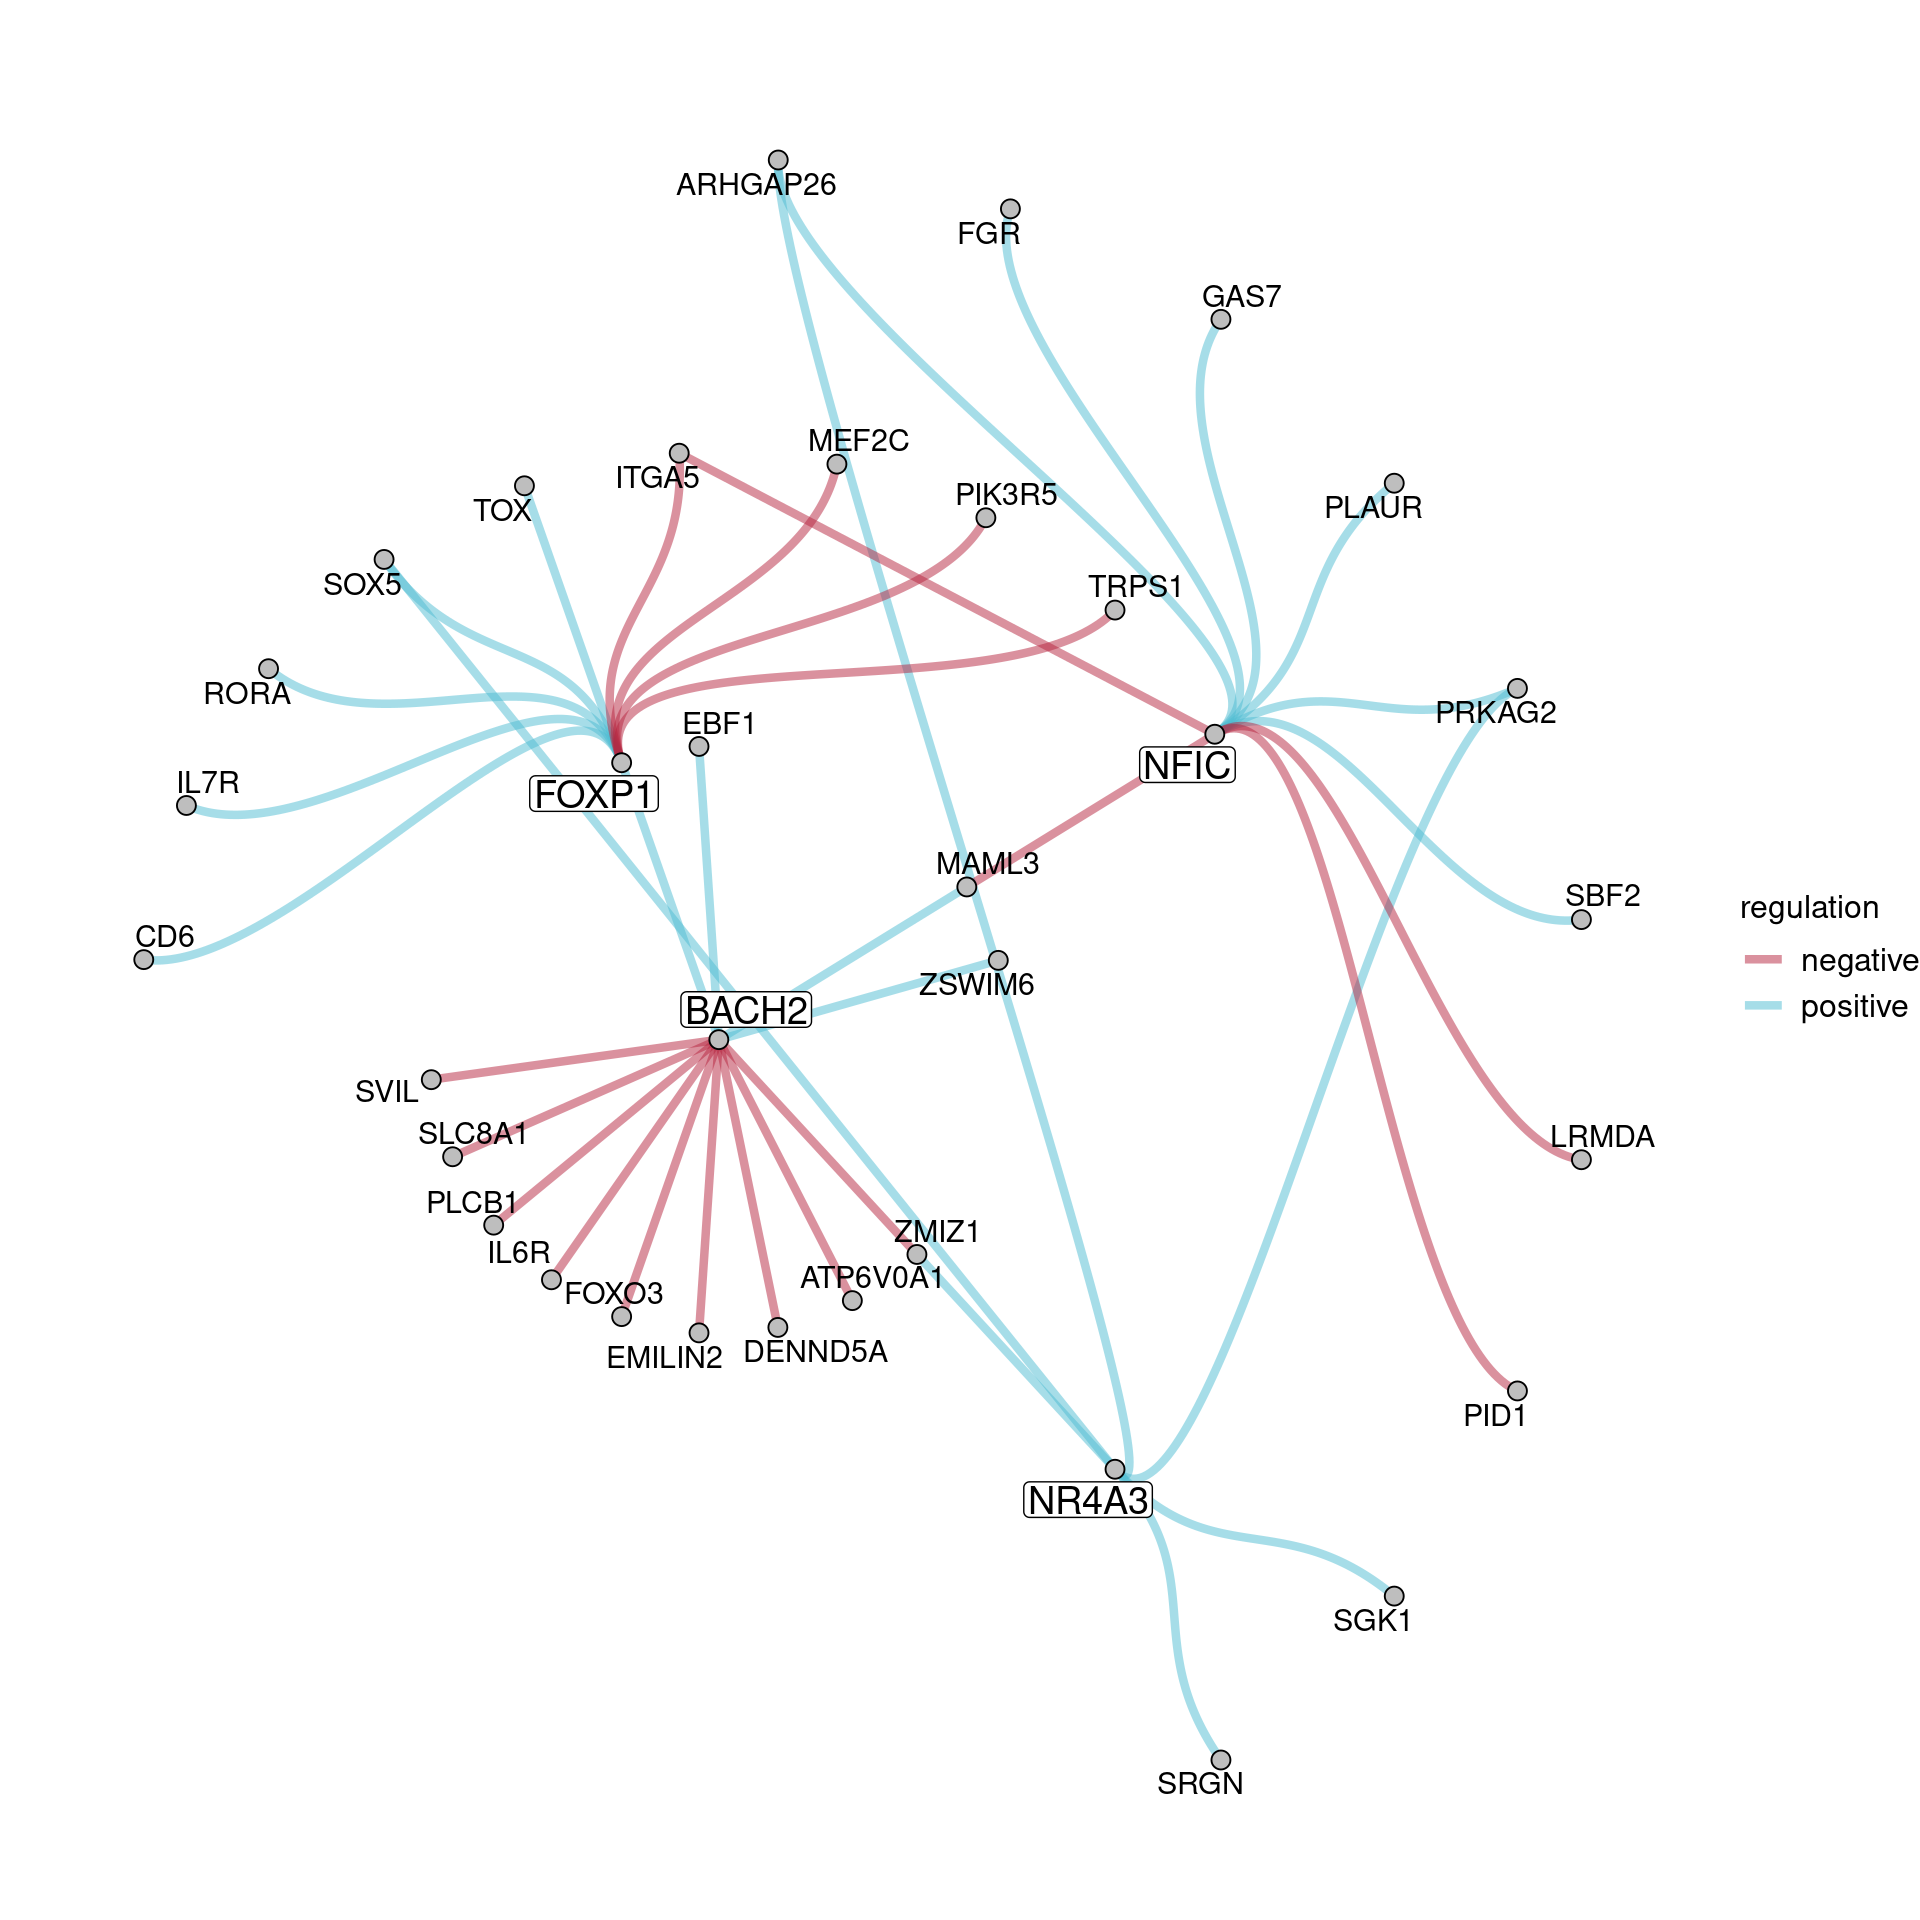
This chapter draws the same PASC- and Healthy-associated TF subnetworks as
the previous chapter, but built directly from the regulon-to-target-gene
table (TF_regulation.txt, Regulon Activity Scoring chapter) with
tidygraph/ggraph, rather than through Pando’s graph objects. This is a
lighter-weight alternative — useful when only the regulon table is
available, without needing the full grn_object. Helps customizing the plot and makes it readable
29.3 PASC subnetwork
PASC_edges <- TF_regulation[TF_regulation$group %in% tf_PASC, ]

PASC_graph <- as_tbl_graph(PASC_edges, directed = FALSE) %>%
  activate(nodes) %>%
  mutate(is_tf = name %in% tf_PASC)

ggraph(PASC_graph, layout = "tree", circular = TRUE) +
  geom_edge_diagonal(aes(color = regulation), alpha = 0.5, width = 1.5) +
  geom_node_point(size = 1, shape = 21, stroke = 0.5, fill = "grey") +
  geom_node_text(aes(label = ifelse(is_tf, "", name)), repel = TRUE, size = 4) +
  geom_node_label(aes(label = ifelse(is_tf, name, "")), size = 5,
                  label.padding = unit(0.05, "cm"), label.size = 0.1, repel = TRUE) +
  scale_edge_color_manual(values = c("positive" = "#4fbbd1", "negative" = "#b5243e")) +
  scale_x_continuous(expand = c(0.1, 0)) +
  scale_y_continuous(expand = c(0.1, 0), trans = "reverse") +
  theme_void() +
  coord_flip() +
  theme(legend.text = element_text(size = 12), legend.title = element_text(size = 12))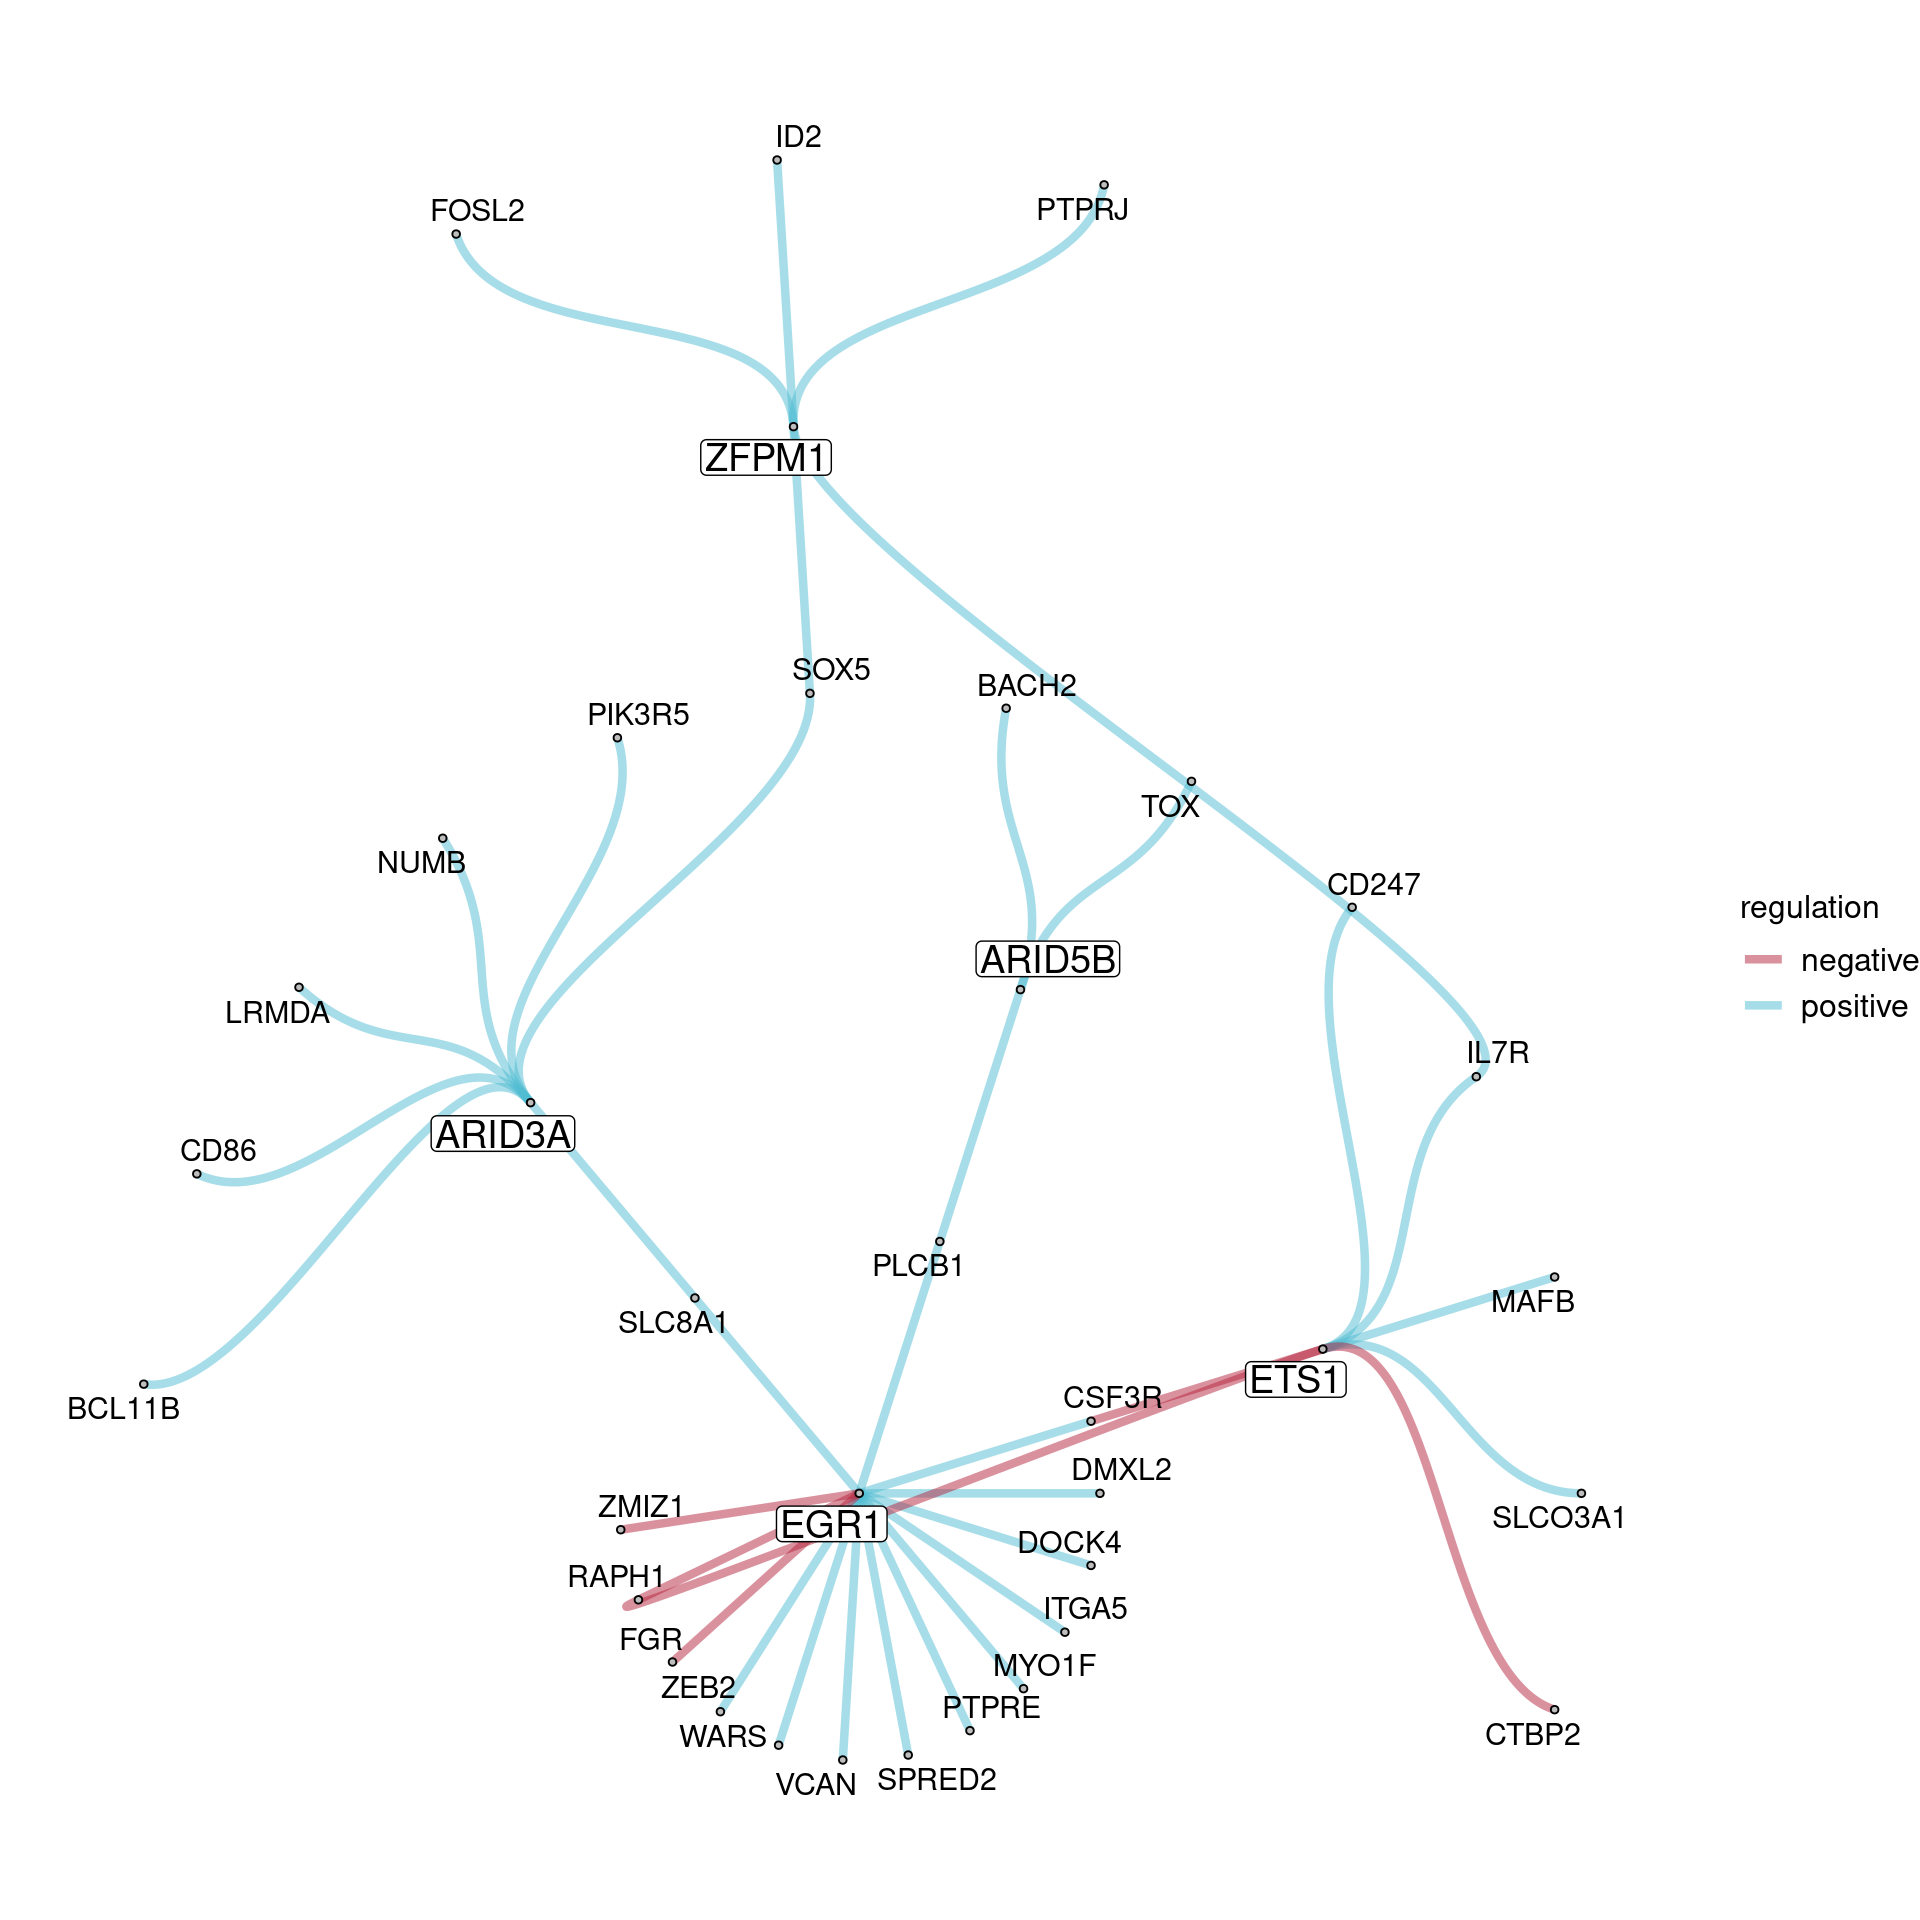
29.4 Healthy subnetwork
Healthy_edges <- TF_regulation[TF_regulation$group %in% tf_healthy, ]

Healthy_graph <- as_tbl_graph(Healthy_edges, directed = FALSE) %>%
  activate(nodes) %>%
  mutate(is_tf = name %in% tf_healthy)

ggraph(Healthy_graph, layout = "tree", circular = TRUE) +
  geom_edge_diagonal(aes(color = regulation), alpha = 0.5, width = 1.5) +
  geom_node_point(size = 3, shape = 21, stroke = 0.5, fill = "grey") +
  geom_node_text(aes(label = ifelse(is_tf, "", name)), repel = TRUE, size = 4) +
  geom_node_label(aes(label = ifelse(is_tf, name, "")), size = 5,
                  label.padding = unit(0.05, "cm"), label.size = 0.1, repel = TRUE) +
  scale_edge_color_manual(values = c("positive" = "#4fbbd1", "negative" = "#b5243e")) +
  scale_x_continuous(expand = c(0.1, 0)) +
  scale_y_continuous(expand = c(0.1, 0), trans = "reverse") +
  theme_void() +
  coord_flip() +
  theme(legend.text = element_text(size = 12), legend.title = element_text(size = 12))