26 Pseudobulk Differential Expression
Differential expression between Healthy and PASC cells is tested two ways
in this chapter and the next: pseudobulk RNA and ATAC counts per cell type
via limma-voom (this chapter, following (Pseudobulk_template.Rmd)[https://github.com/MonashBioinformaticsPlatform/SCmultiomics_longCOVID] /
(render_pseudobulk_html.R)[https://github.com/MonashBioinformaticsPlatform/SCmultiomics_longCOVID]), and pseudobulk regulon activity via limma
(Regulon Differential Expression per Cell Type chapter). Both aggregate to
one value per sample/condition/cell-type combination before testing,
rather than testing at the per-cell level — cells from the same sample are
correlated (pseudoreplicates), and per-cell tests that treat them as
independent observations are well documented to produce inflated,
overconfident significance for condition-level comparisons (e.g. Squair et
al. 2021, Nat Commun). RNA/ATAC counts and regulon activity scores are
nonetheless tested with different pipelines: pseudobulking sums counts
across cells, which suits edgeR’s count-based normalisation (TMM) and
the voom mean-variance model built on top of it. Regulon activity
(regulon assay) is a continuous, mean-centred AddModuleScore value
that can be negative — summing it does not yield anything analogous to a
sequencing-depth-scaled library, and TMM normalisation is not defined for
values that can be ≤0. The regulon chapter instead aggregates by group
mean and fits limma directly on the continuous scores, weighted by the
inverse variance of each mean.
26.2 Pseudobulk RNA and ATAC expression per cell type
RNA and ATAC counts are each aggregated per sample/condition within a
cell type (sample_individual_condition within one cell_labels
cluster), giving one pseudobulk column per biological replicate (sample x
condition). voom converts the count-based DGEList to log-CPM values
with precision weights that account for the mean-variance relationship of
count data, so that limma’s lmFit/eBayes can then be used as if on
continuous data — this is the same three-step count -> voom -> limma
pipeline Pseudobulk_template.Rmd used for both assays.
library(EnhancedVolcano)
library(dplyr)

pseudobulk_voom_de <- function(obj_ct, assay) {
  pb <- AggregateExpression(obj_ct, group.by = "sample_individual_condition",
                            slot = "counts", assays = assay)[[assay]]


  condition <- factor(ifelse(grepl("Healthy$", colnames(pb)), "Healthy", "PASC"),
                      levels = c("Healthy", "PASC"))
  if (length(unique(condition)) < 2) return(NULL)

  design <- model.matrix(~condition)

  tryCatch({
    dge <- DGEList(pb)
    keep <- filterByExpr(dge, design)
    dge <- dge[keep, , keep.lib.sizes = FALSE]
    dge <- calcNormFactors(dge)

    vm <- voom(dge, design = design, plot = FALSE)
    fit <- lmFit(vm, design = design)
    fit <- eBayes(fit)

    res <- topTable(fit, n = Inf, adjust.method = "BH")
    arrange(res, adj.P.Val)
  }, error = function(e) NULL)
}
26.2.1 Example cell type
celltype <- "cluster_0"
obj_ct <- combined[, combined$cell_labels == celltype]

de_rna <- pseudobulk_voom_de(obj_ct, assay = "RNA")

ggplot(de_rna, aes(x = AveExpr, y = logFC, col = adj.P.Val < 0.05)) +
  geom_point() + theme_bw() + ggtitle("Pseudobulk RNA")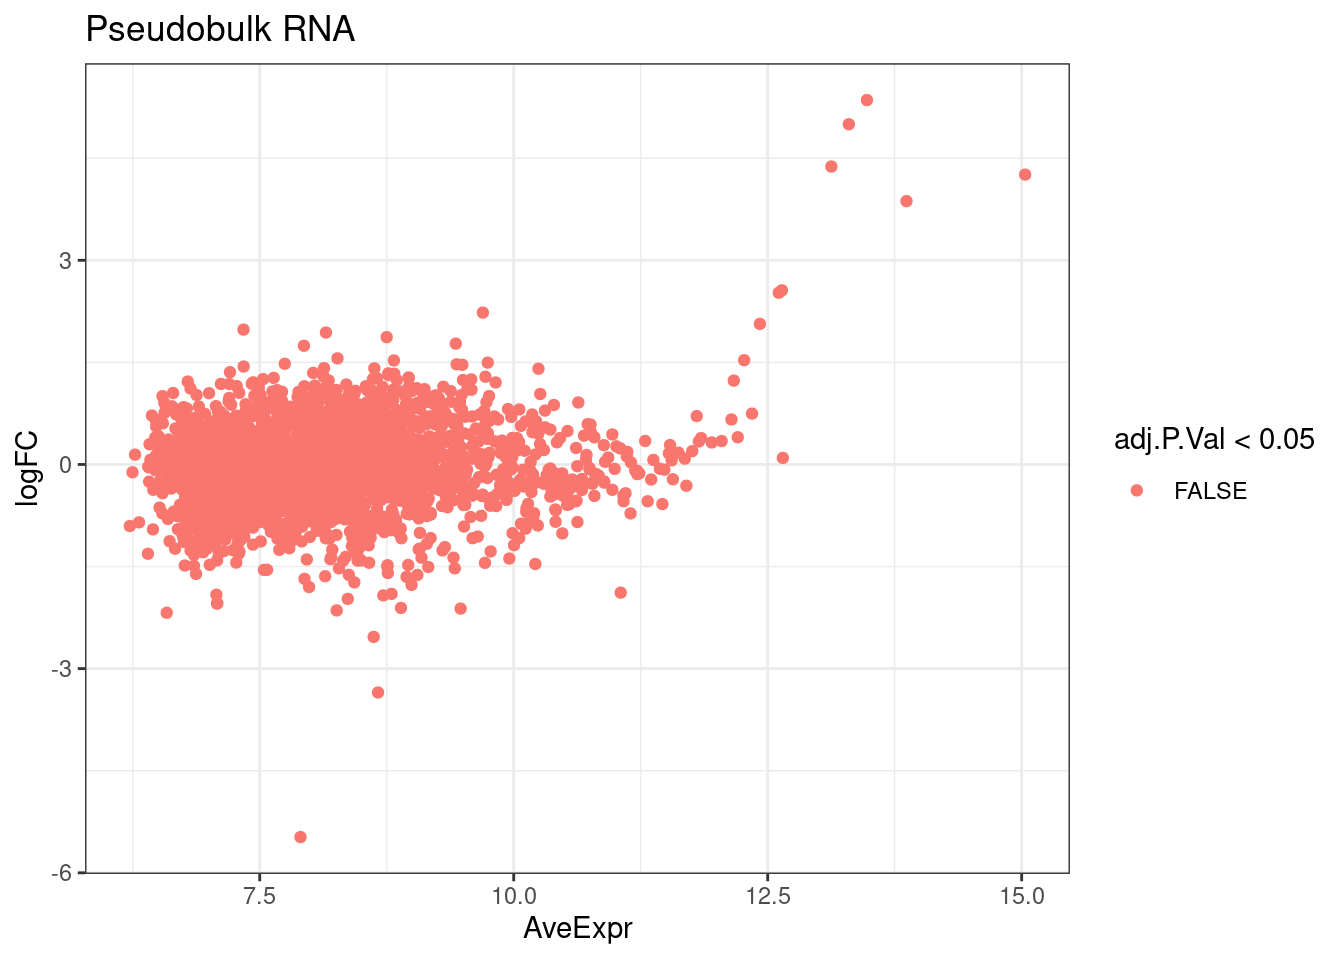
EnhancedVolcano(de_rna, lab = rownames(de_rna), x = "logFC", y = "adj.P.Val",
               pCutoff = 0.05, xlab = "logFC", ylab = "-log10(adj.P.Val)")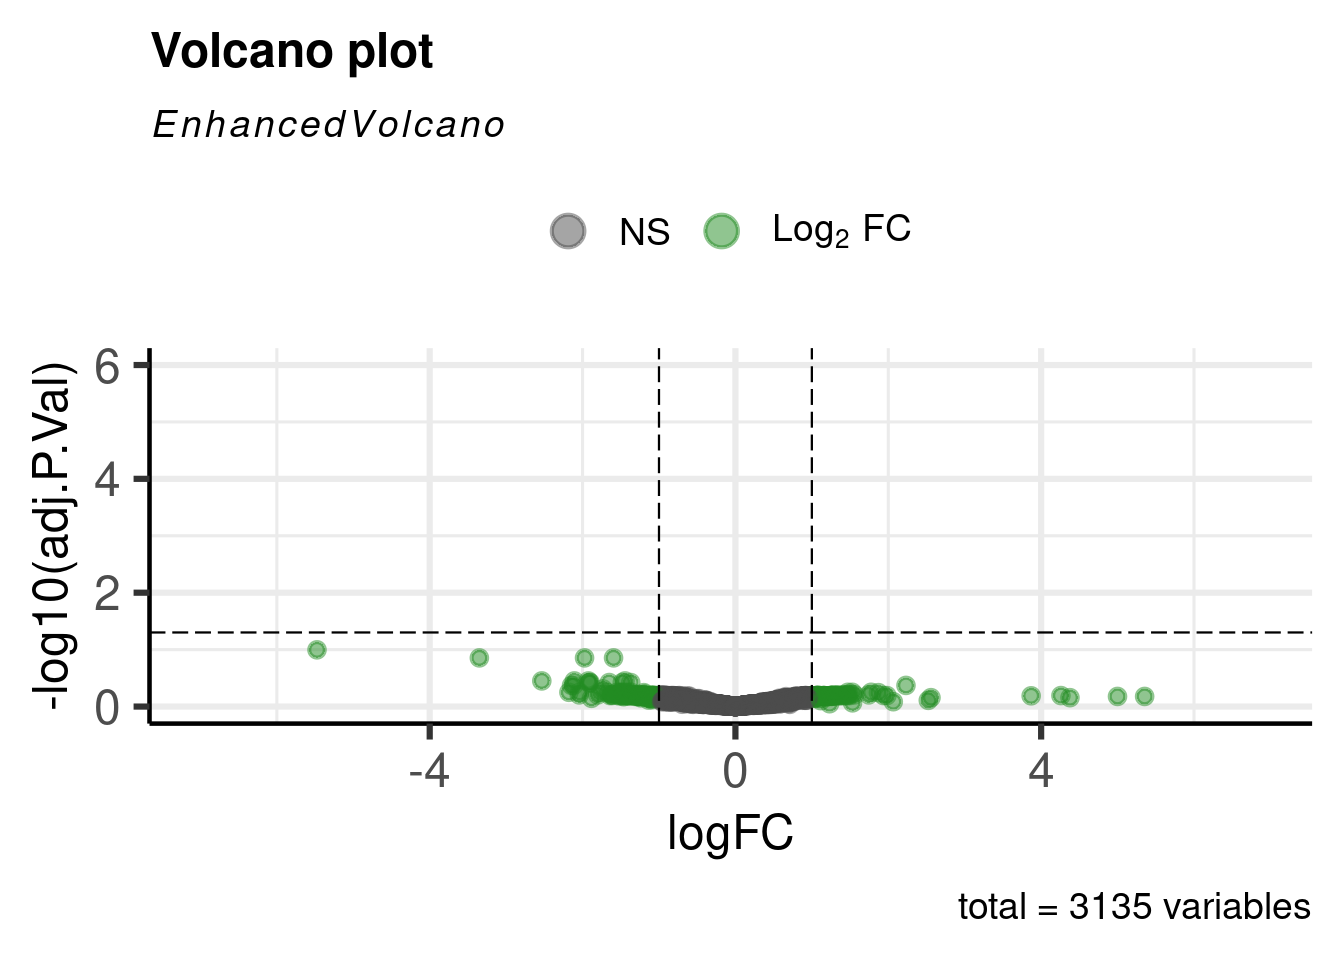
de_atac <- pseudobulk_voom_de(obj_ct, assay = "ATAC")

ggplot(de_atac, aes(x = AveExpr, y = logFC, col = adj.P.Val < 0.05)) +
  geom_point() + theme_bw() + ggtitle("Pseudobulk ATAC")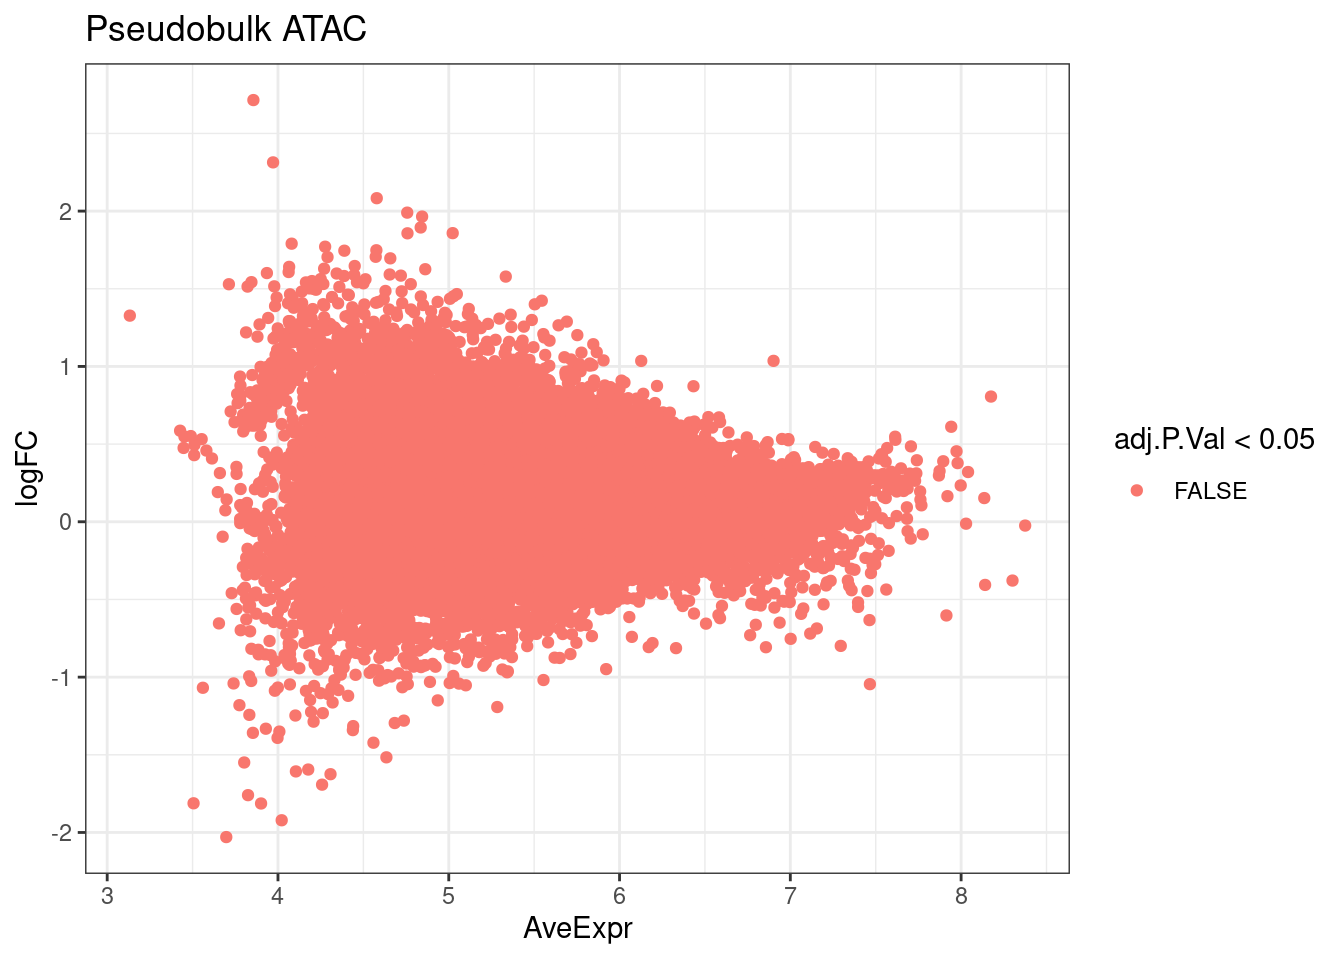
EnhancedVolcano(de_atac, lab = rownames(de_atac), x = "logFC", y = "adj.P.Val",
               pCutoff = 0.05, xlab = "logFC", ylab = "-log10(adj.P.Val)")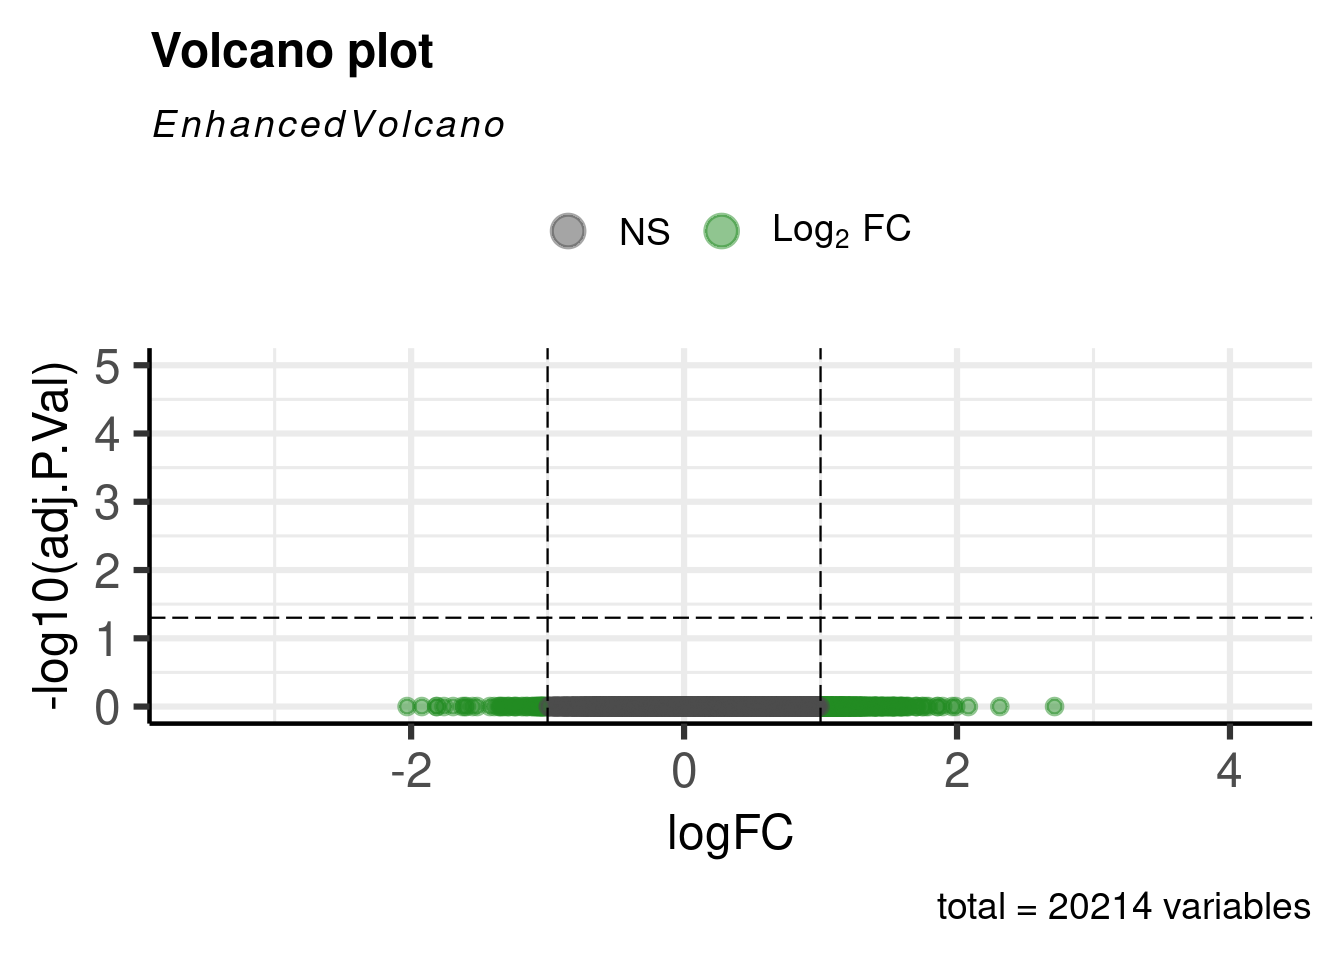
26.2.2 All cell types
celltypes <- unique(combined$cell_labels)

pseudobulk_rna_de <- list()
pseudobulk_atac_de <- list()

for (ct in celltypes) {
  obj_ct <- combined[, combined$cell_labels == ct]

  res_rna <- pseudobulk_voom_de(obj_ct, assay = "RNA")
  if (!is.null(res_rna)) {
    res_rna$gene <- rownames(res_rna)
    res_rna$cell_labels <- ct
    pseudobulk_rna_de[[ct]] <- res_rna
  }

  res_atac <- pseudobulk_voom_de(obj_ct, assay = "ATAC")
  if (!is.null(res_atac)) {
    res_atac$peak <- rownames(res_atac)
    res_atac$cell_labels <- ct
    pseudobulk_atac_de[[ct]] <- res_atac
  }
}

pseudobulk_rna_de <- do.call(rbind, pseudobulk_rna_de)
pseudobulk_atac_de <- do.call(rbind, pseudobulk_atac_de)

write.table(pseudobulk_rna_de, "data/pseudobulk_rna_de_per_celltype.txt", row.names = FALSE)
write.table(pseudobulk_atac_de, "data/pseudobulk_atac_de_per_celltype.txt", row.names = FALSE)