6 ATAC QC
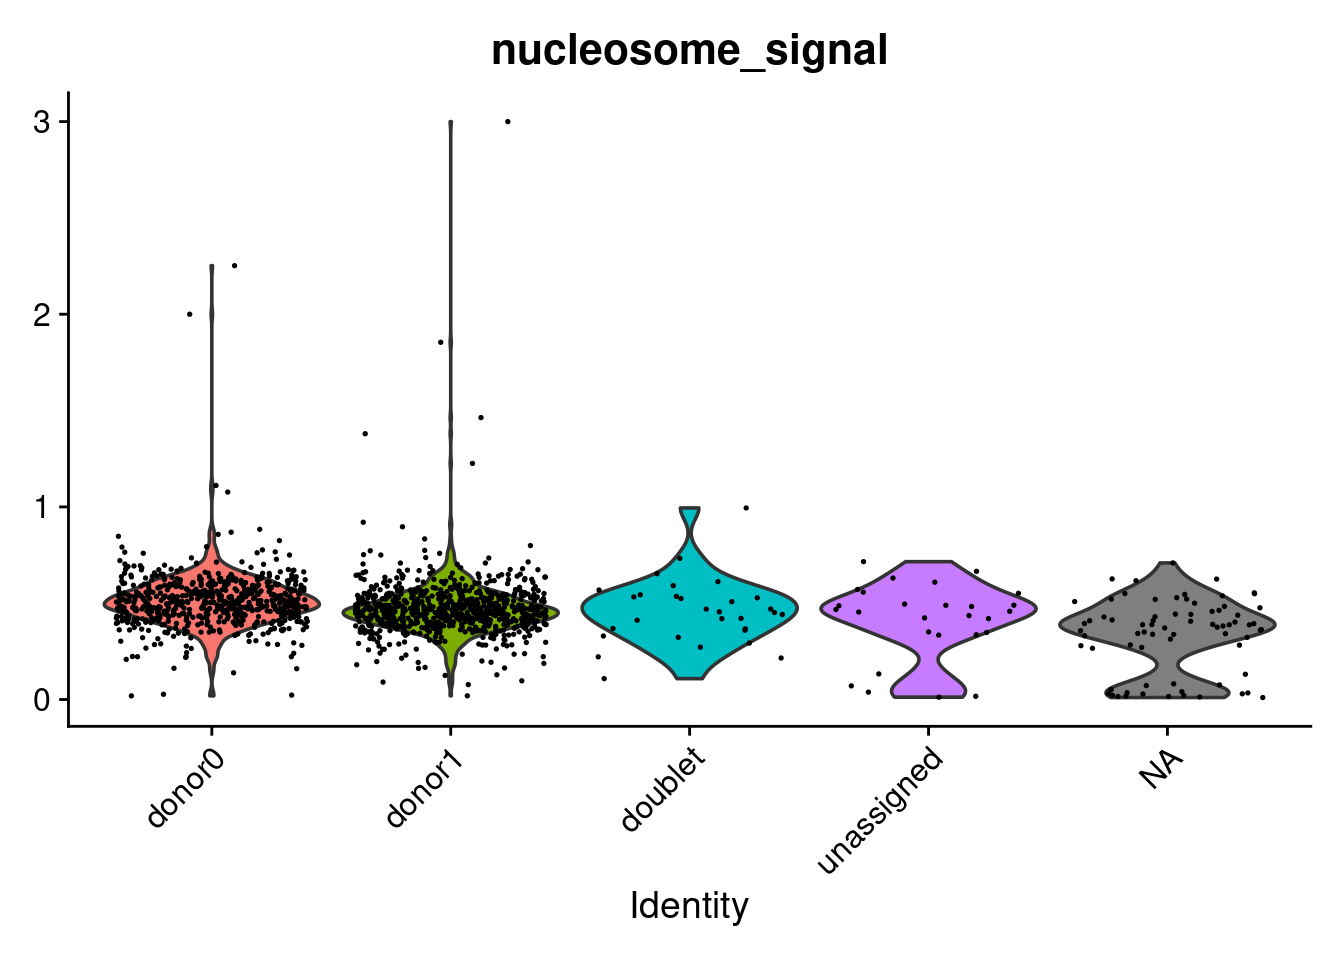
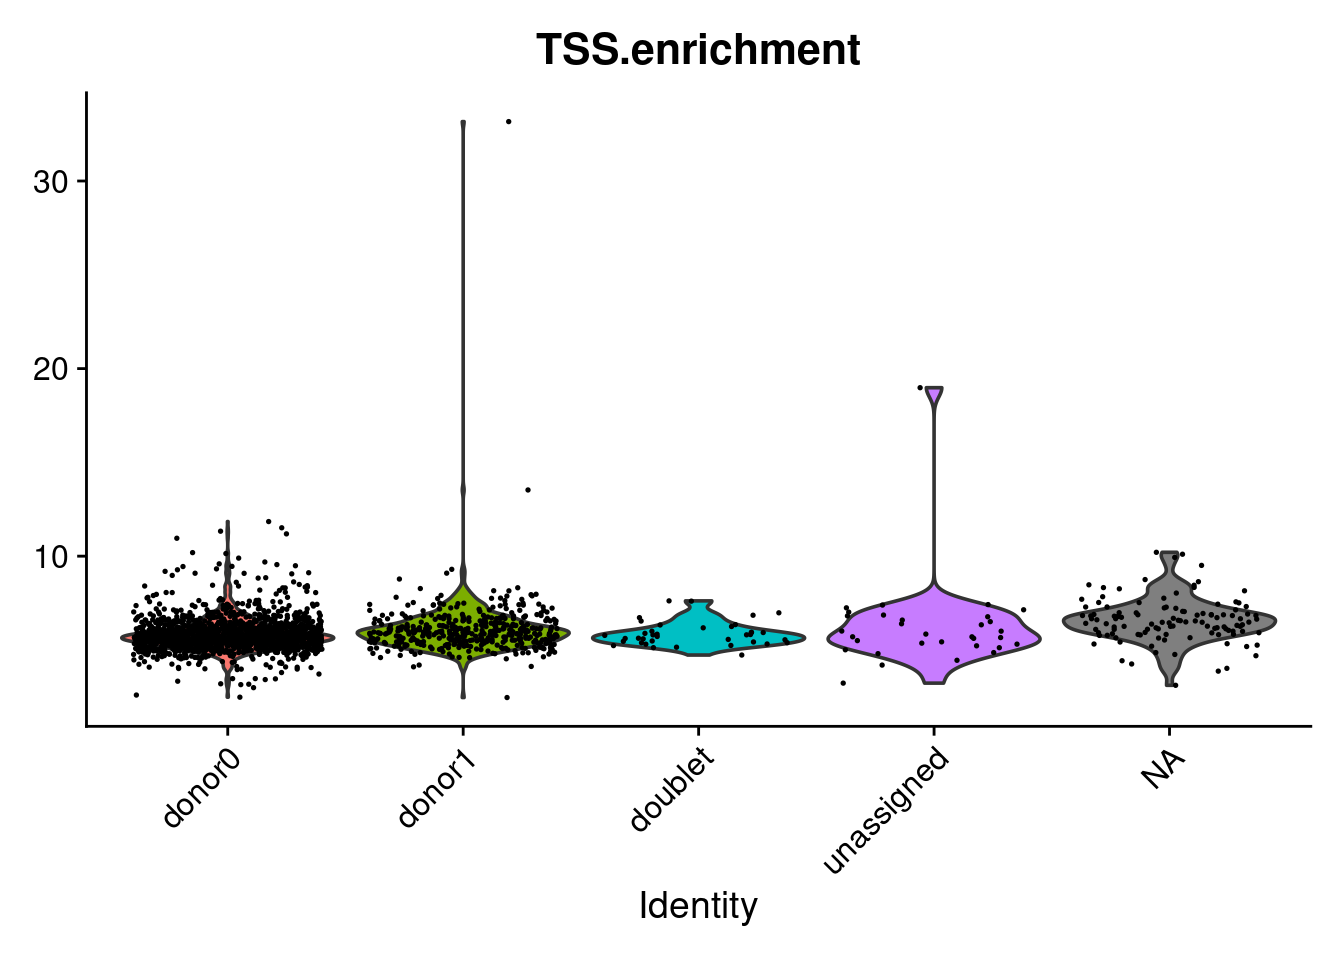
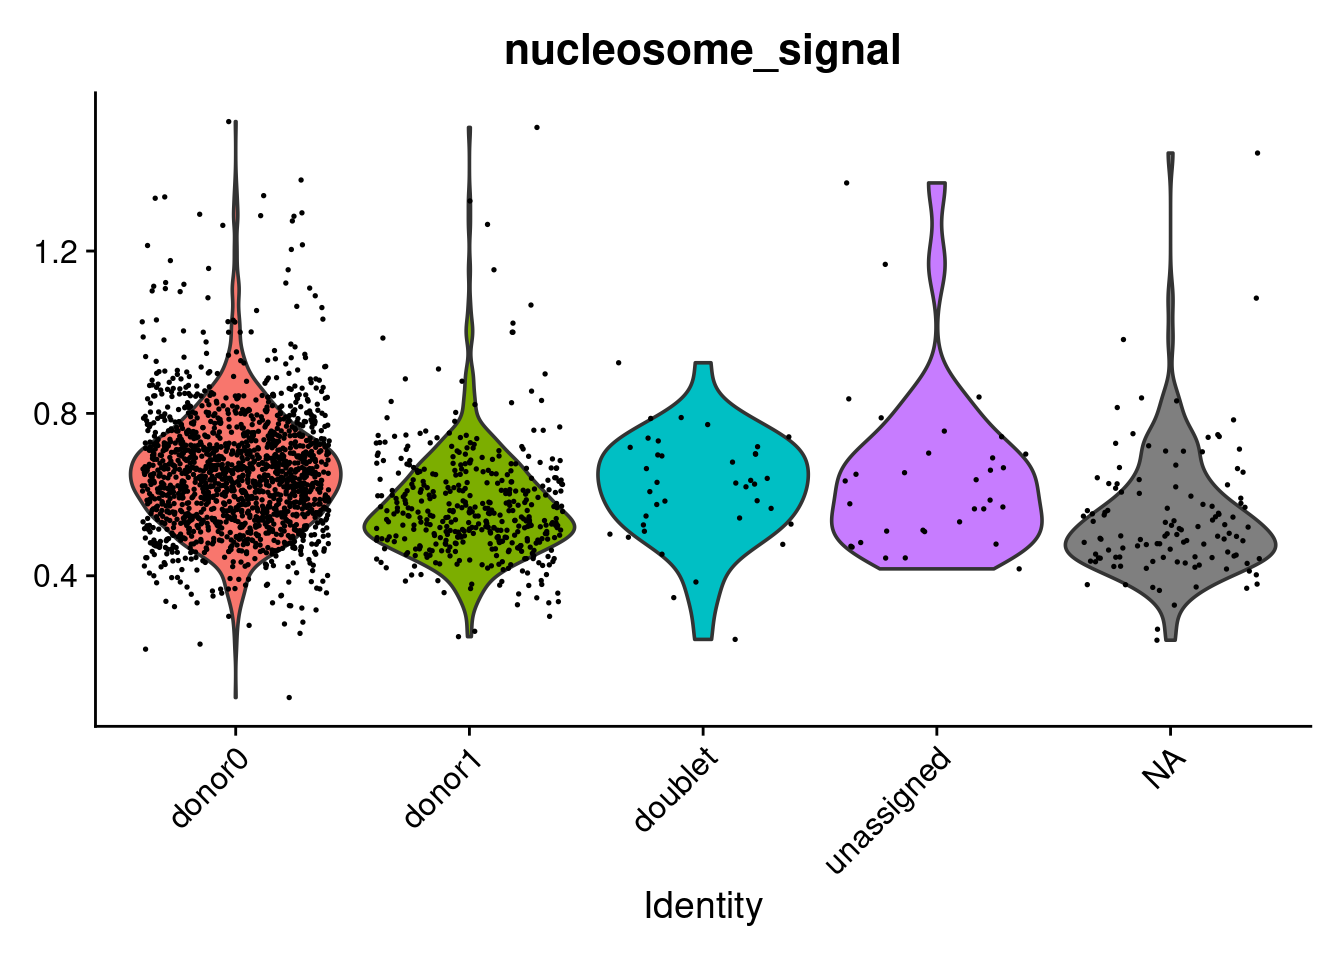
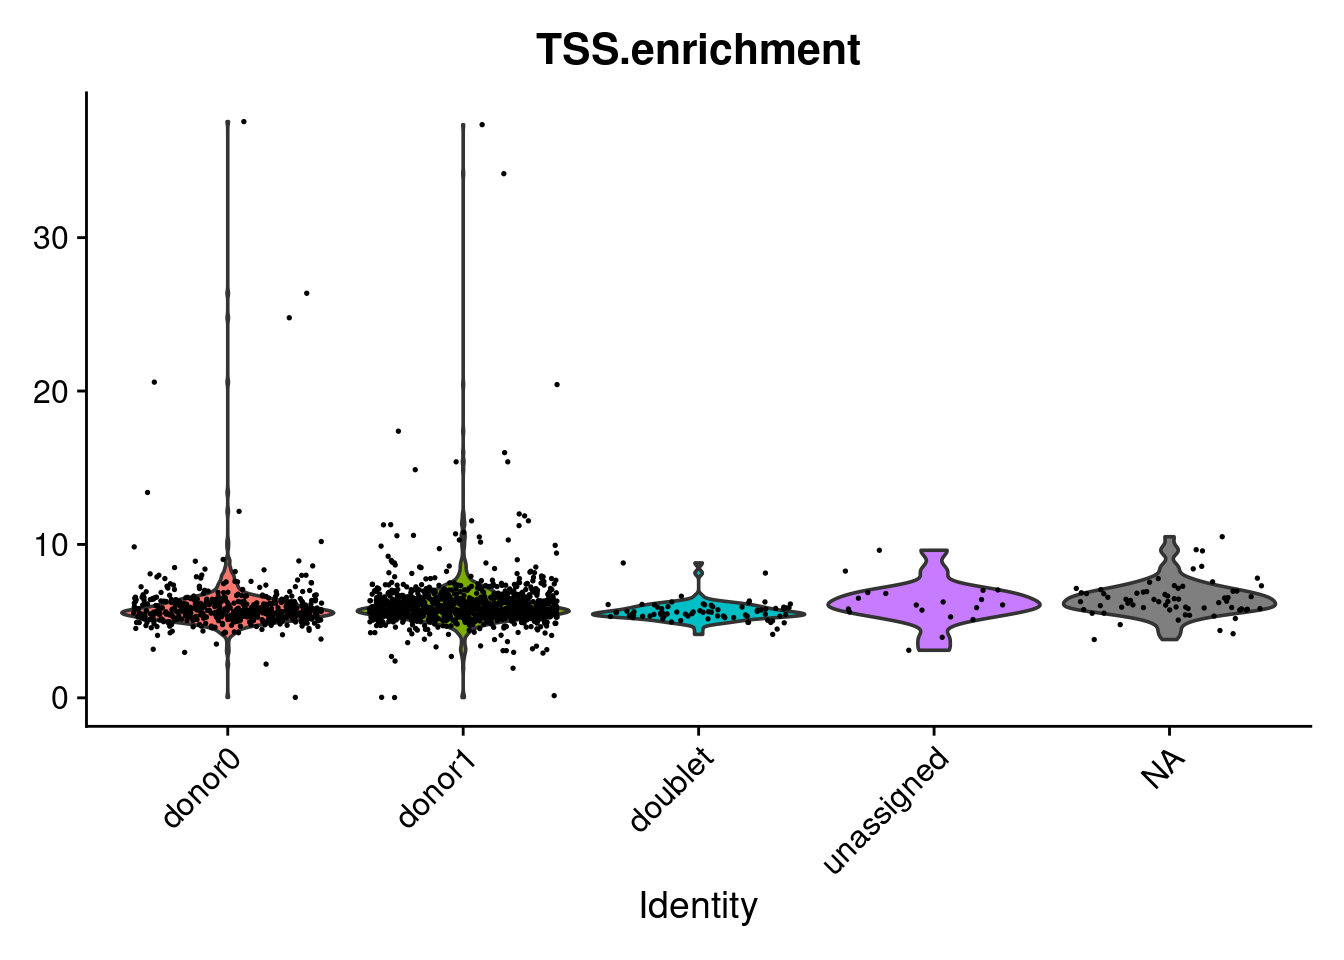
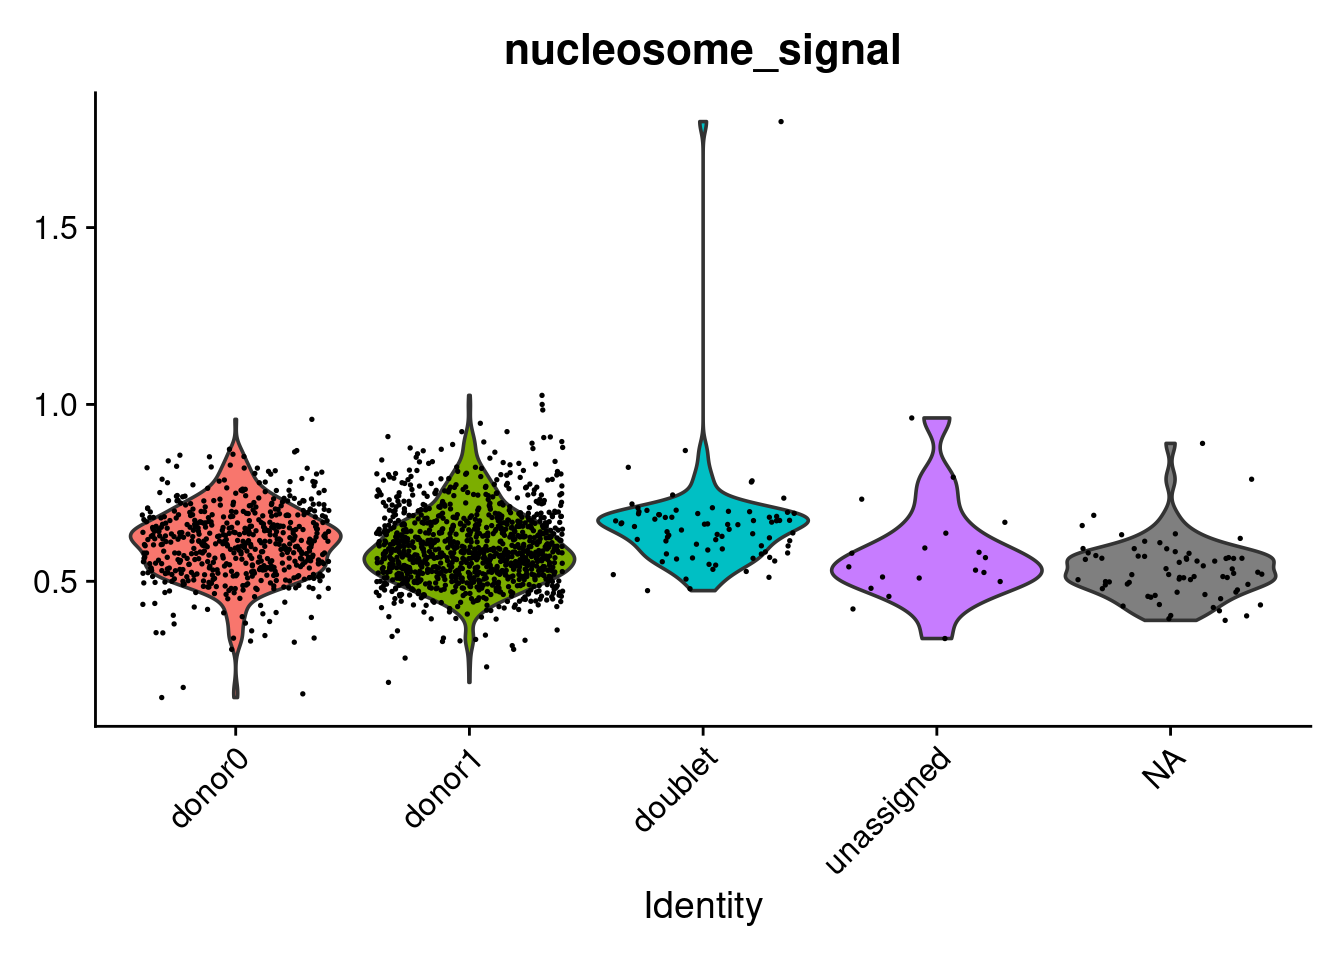
ATAC-seq quality control evaluates the chromatin accessibility library for each cell. The two key ATAC-specific metrics are nucleosome signal and TSS enrichment score. Nucleosome signal measures the ratio of mononucleosomal to nucleosome-free fragments — a low signal indicates a high proportion of accessible (open) chromatin reads, characteristic of a good quality library. TSS enrichment score measures the fold-enrichment of fragments at transcription start sites relative to flanking regions — high TSS enrichment confirms that the ATAC library is capturing accessible regulatory elements rather than background noise.
6.1 Compute ATAC QC metrics
Compute per-cell nucleosome signal and TSS enrichment score for each sample. These metrics are added to the Seurat object metadata alongside the RNA QC metrics computed in the previous chapter.
cntsB <- NucleosomeSignal(cntsB, assay = "ATAC")
cntsB <- TSSEnrichment(cntsB,    assay = "ATAC")

cntsC <- NucleosomeSignal(cntsC, assay = "ATAC")
cntsC <- TSSEnrichment(cntsC,    assay = "ATAC")
#> Processed 9300 groups out of 19947. 47% done. Time elapsed: 13s. ETA: 14s.Processed 19947 groups out of 19947. 100% done. Time elapsed: 13s. ETA: 0s.

cntsD <- NucleosomeSignal(cntsD, assay = "ATAC")
cntsD <- TSSEnrichment(cntsD,    assay = "ATAC")
#> Processed 4545 groups out of 19947. 23% done. Time elapsed: 12s. ETA: 41s.Processed 19947 groups out of 19947. 100% done. Time elapsed: 13s. ETA: 0s.
6.2 ATAC metrics per donor
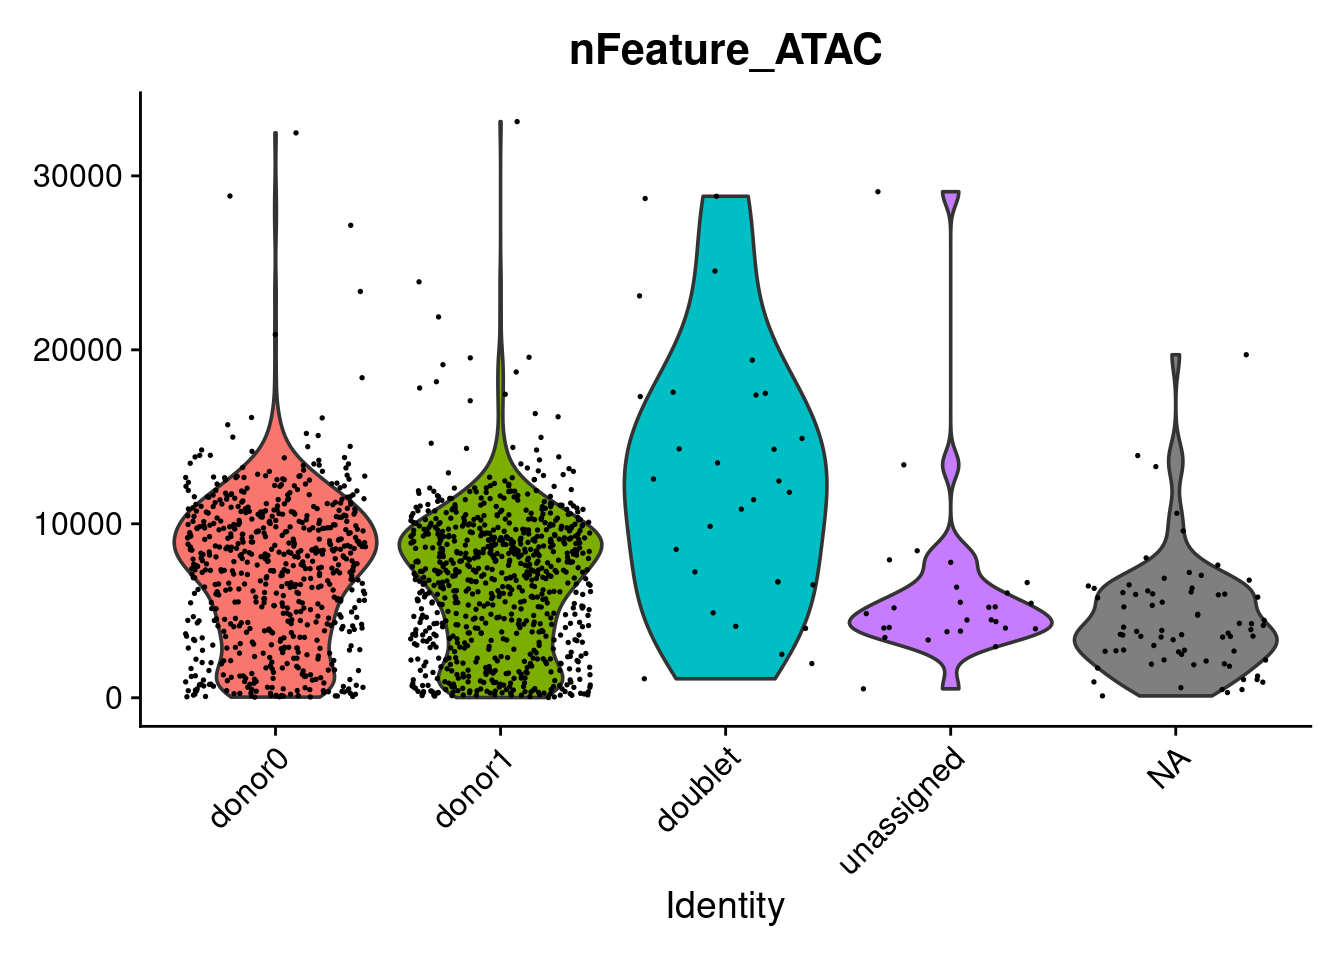
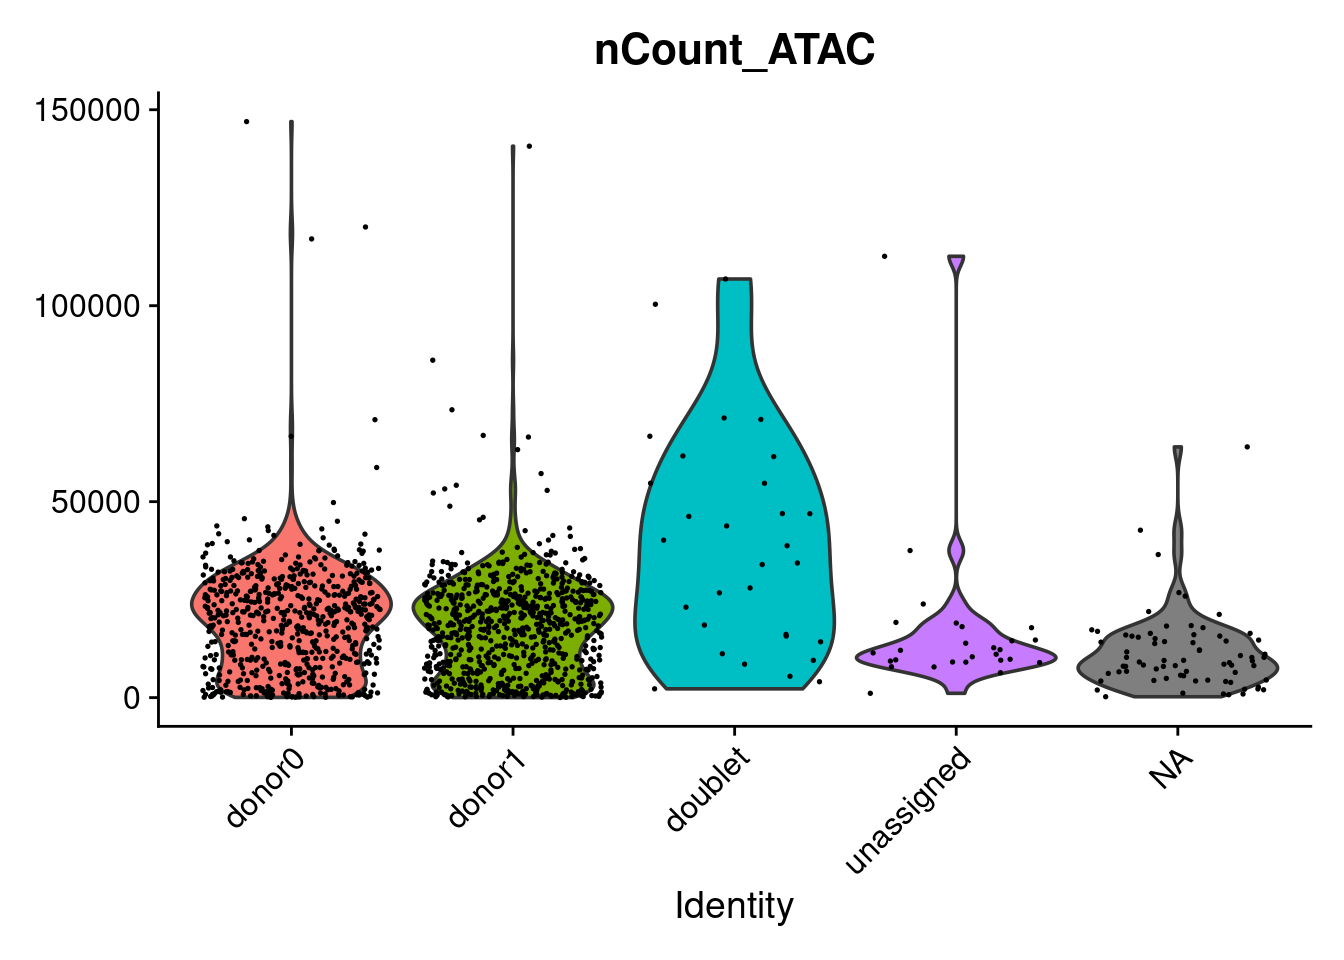
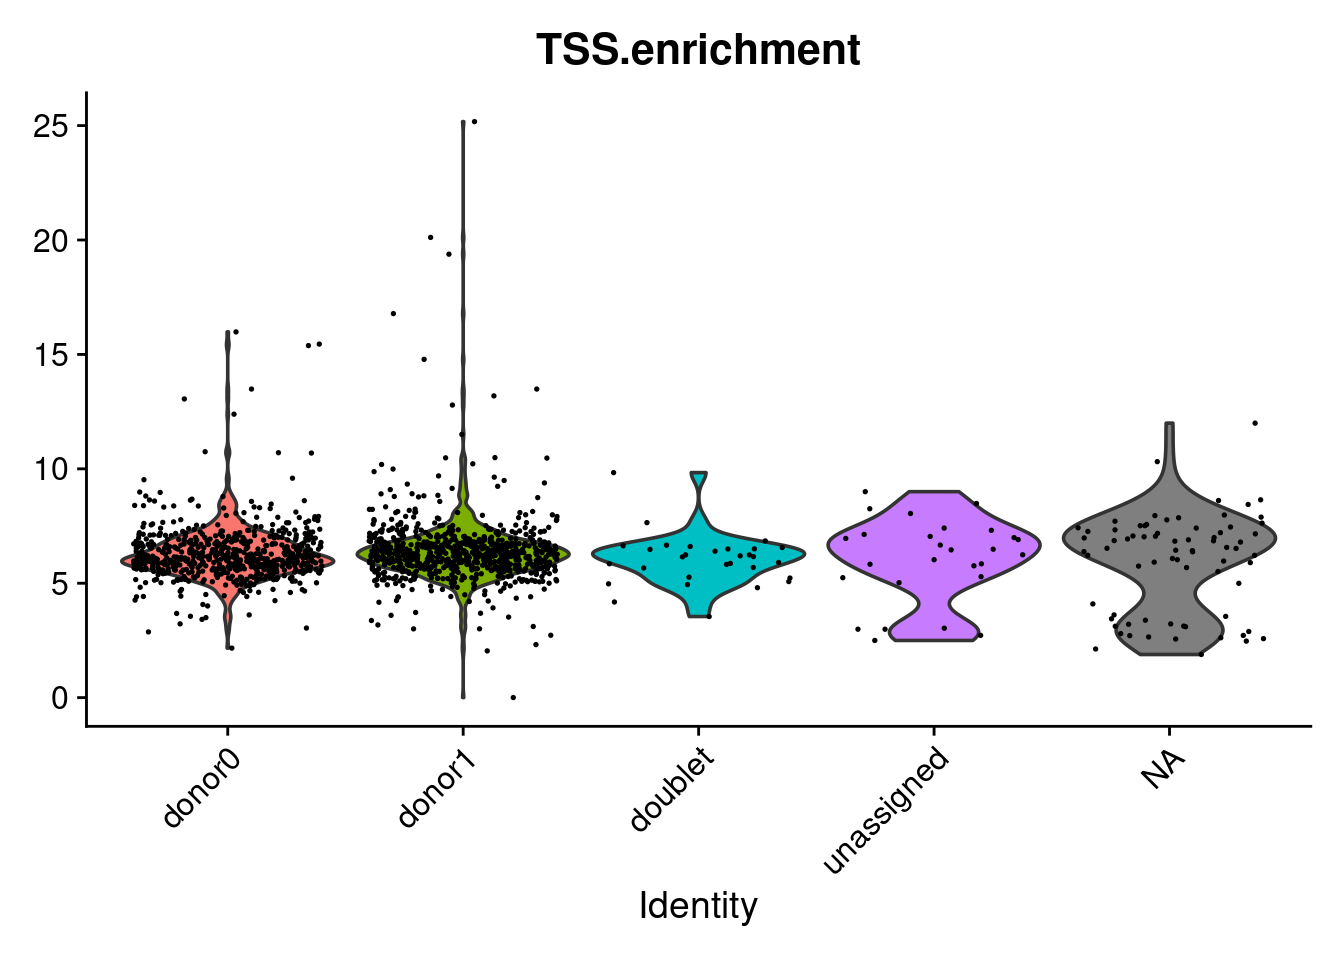
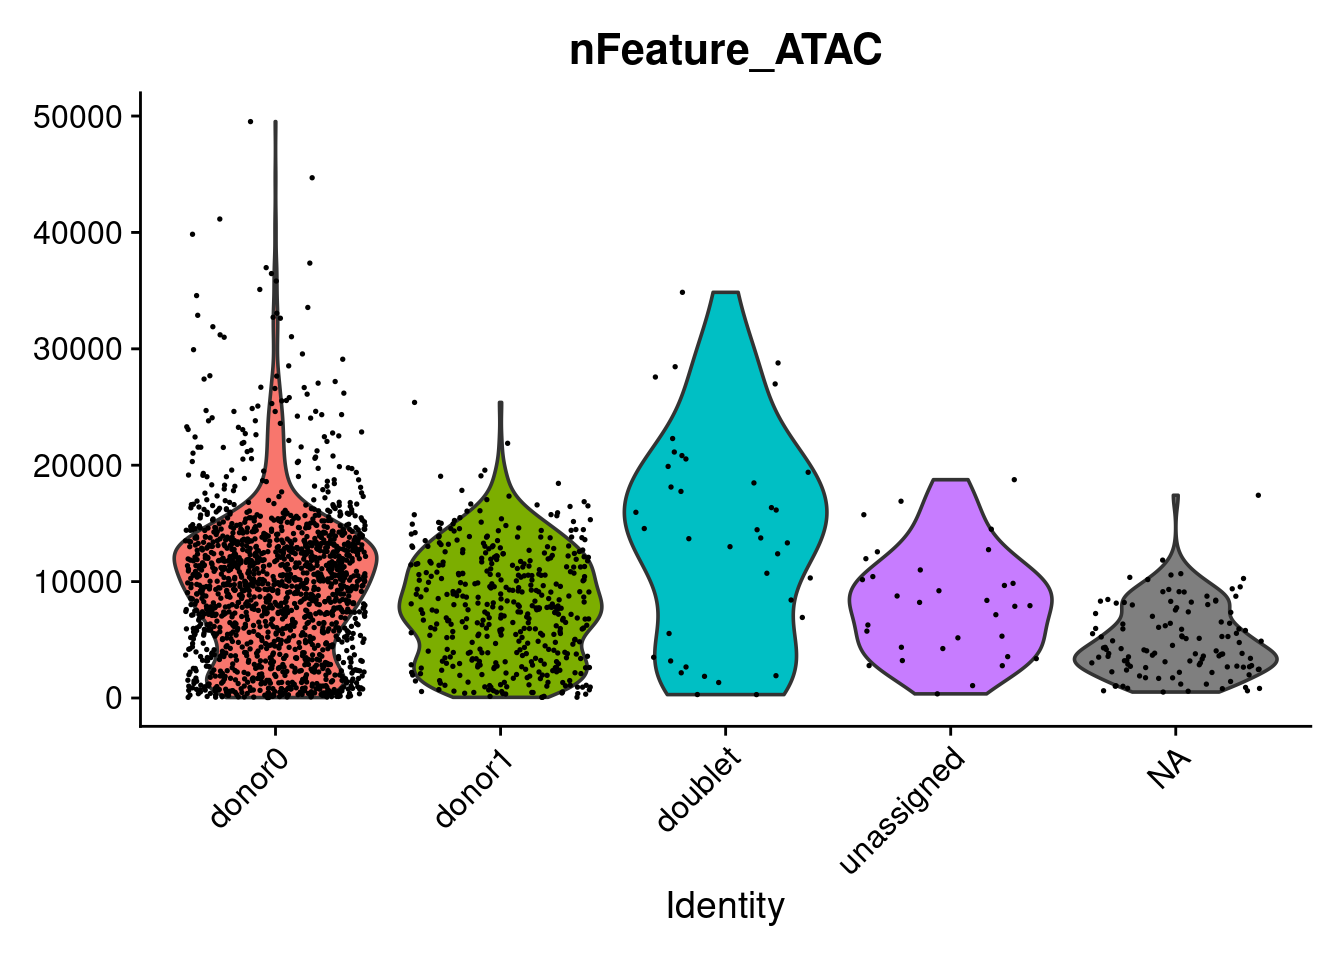
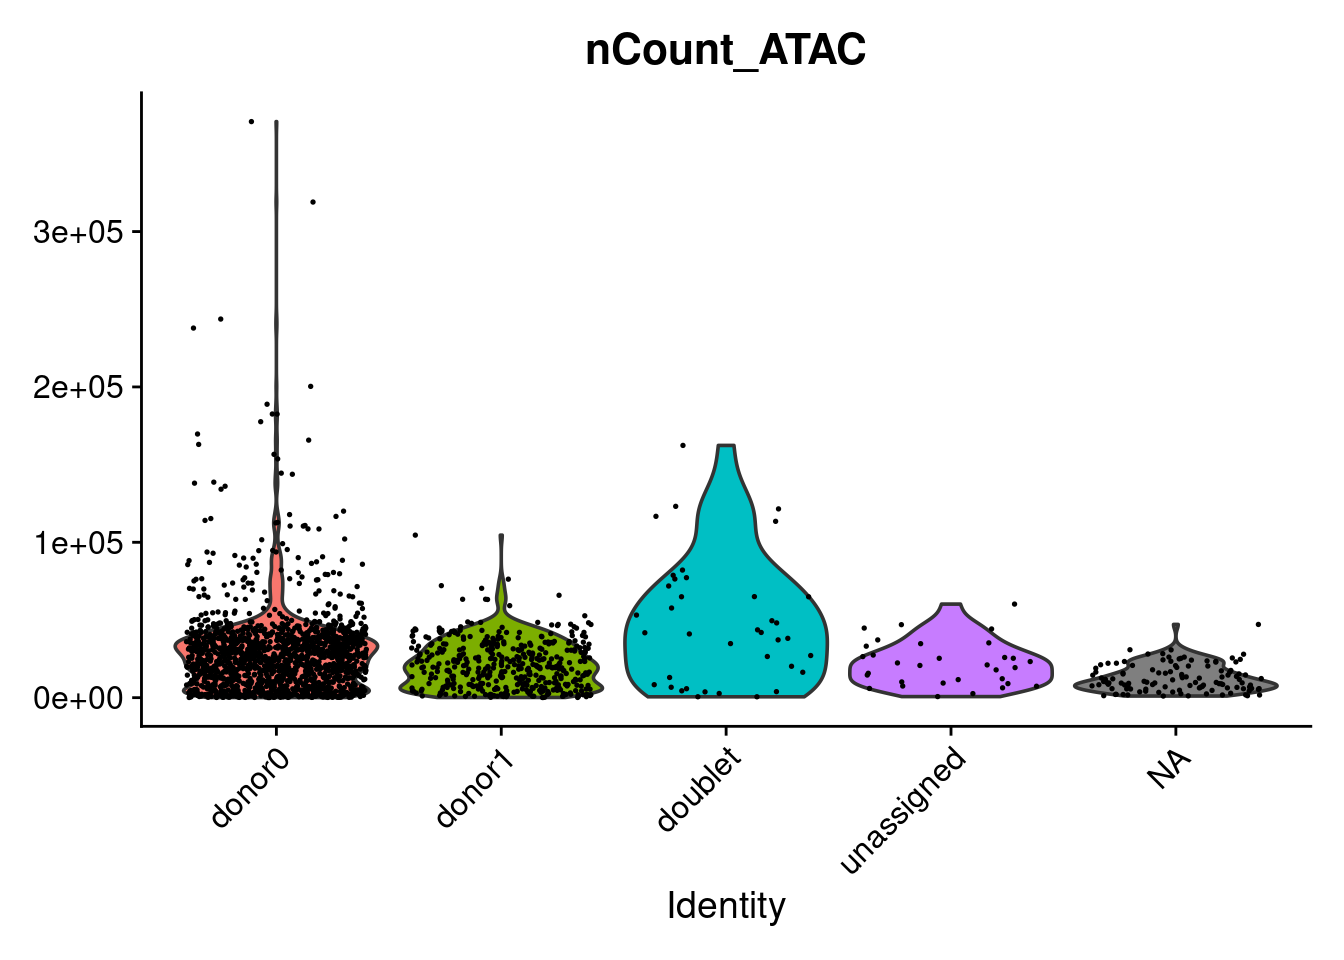
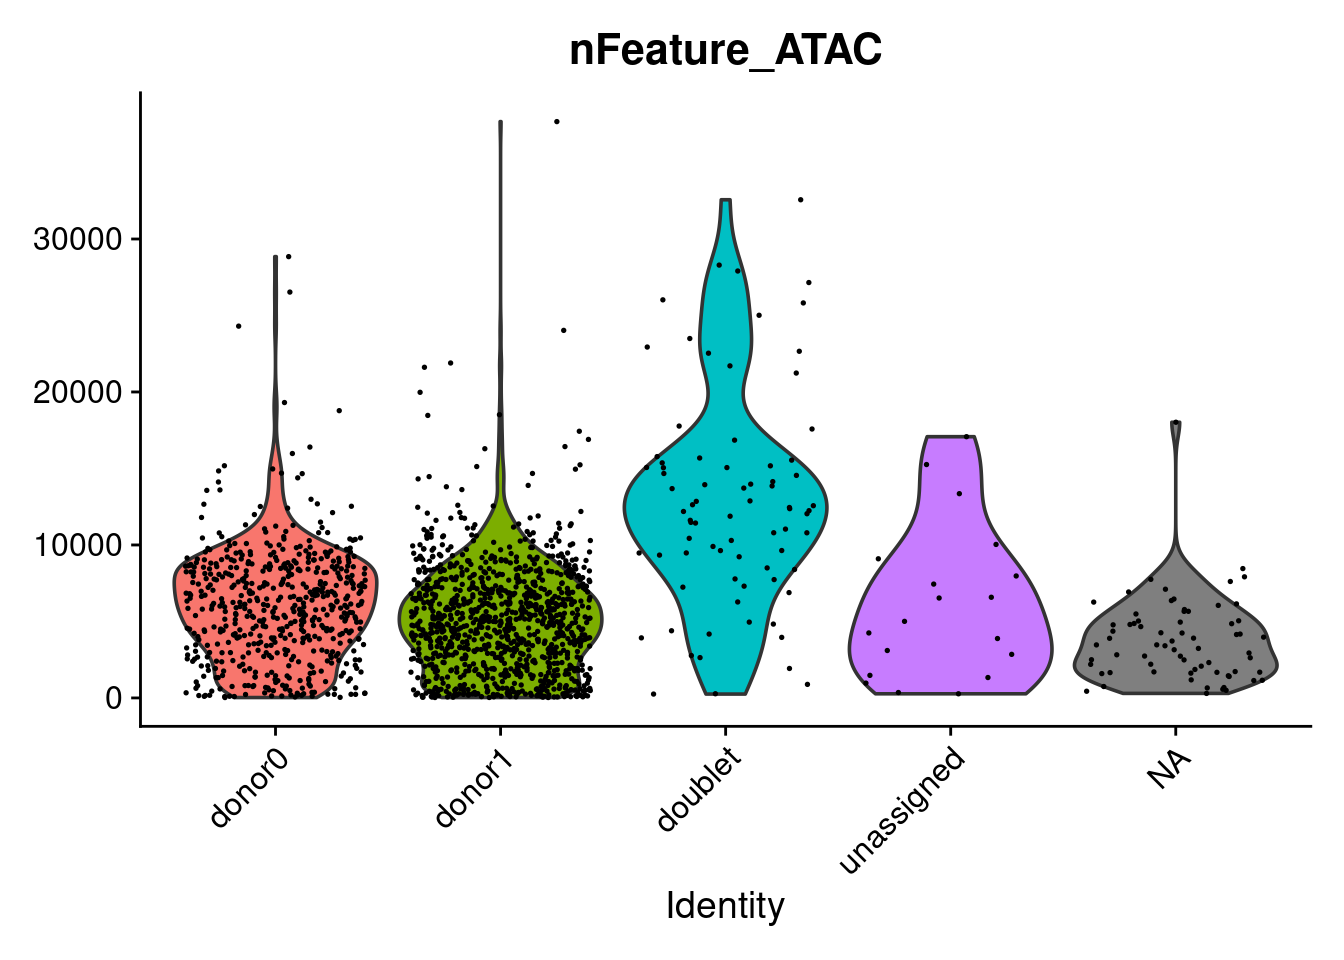
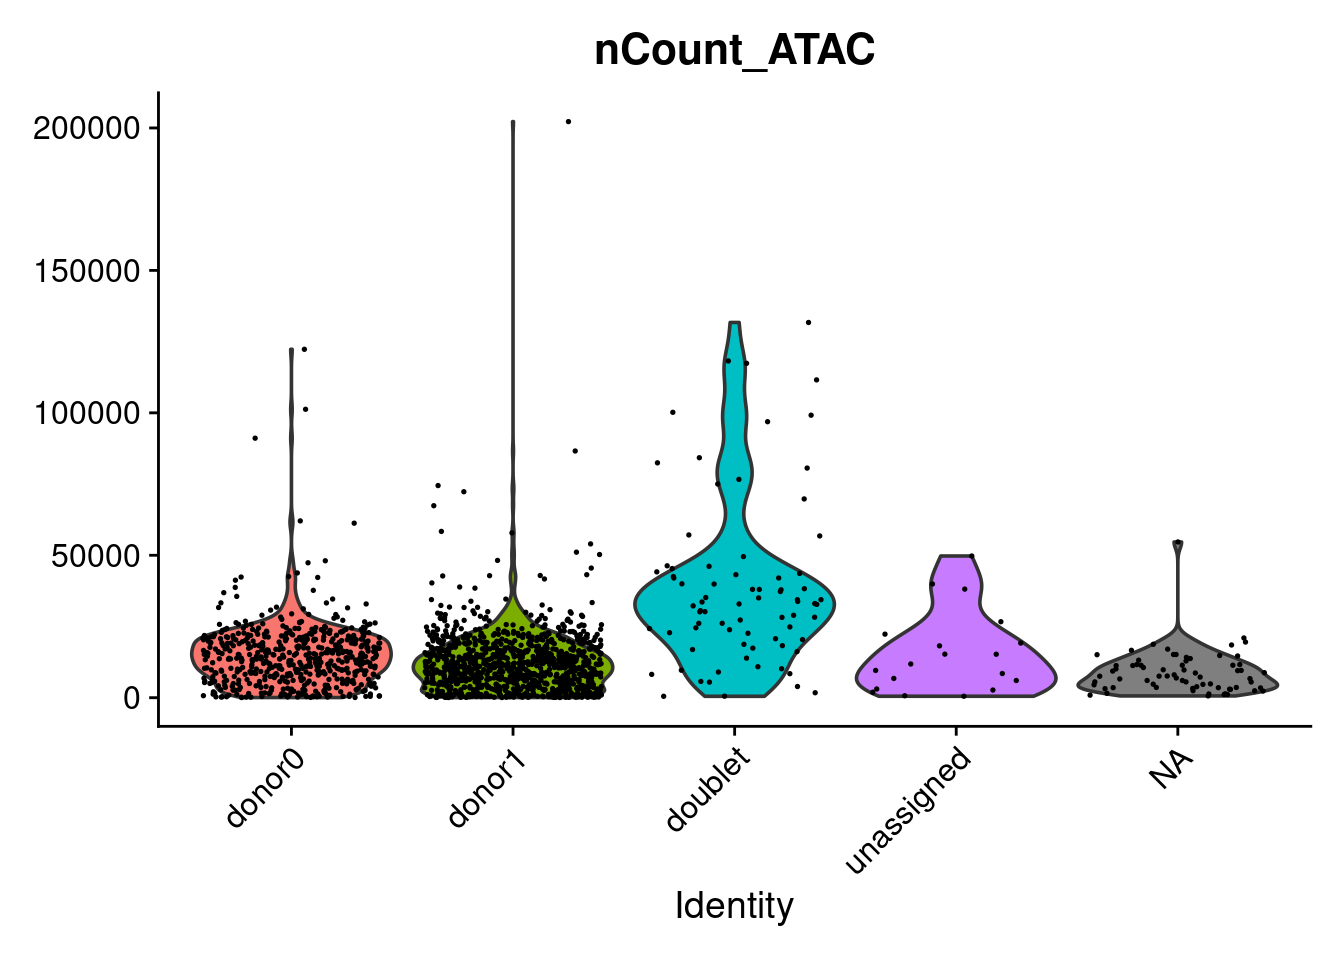
Per-donor violin plots of nFeature_ATAC, nCount_ATAC, TSS.enrichment,
and nucleosome_signal. Comparing donors within the same sample highlights
donor-specific differences in ATAC library quality that could affect
downstream peak calling or differential accessibility analysis.
6.3 TSS enrichment vs ATAC feature count
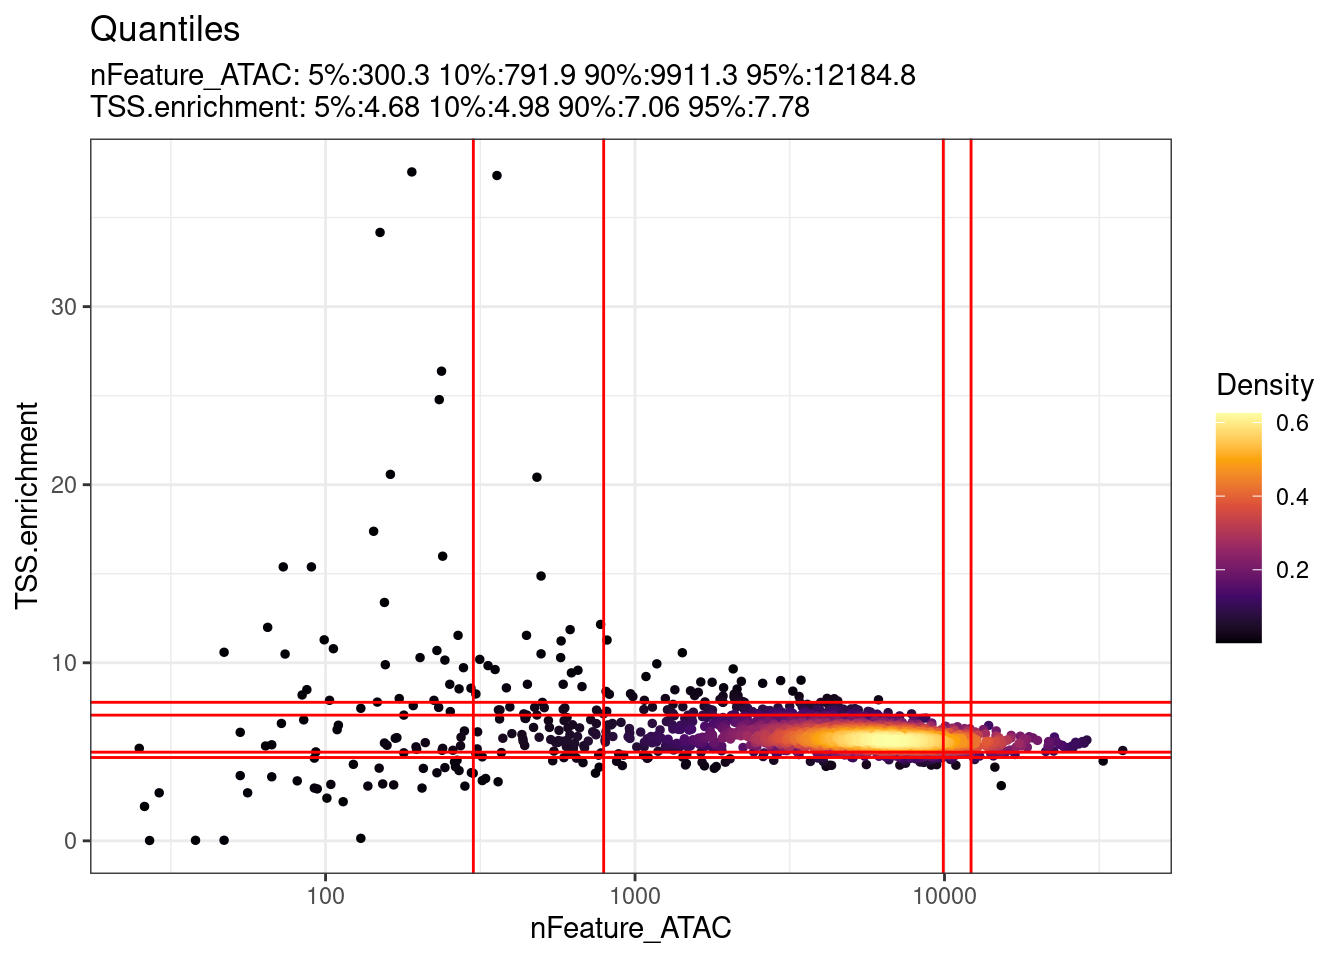
Density scatter plot of nFeature_ATAC against TSS.enrichment. High-quality
cells cluster in the upper-right region (many accessible peaks, high TSS
enrichment). The quantile lines help identify the threshold below which cells
fall outside the expected quality range.
6.3.1 Sample B
DensityScatter(cntsB, x = 'nFeature_ATAC', y = 'TSS.enrichment',
               log_x = TRUE, quantiles = TRUE)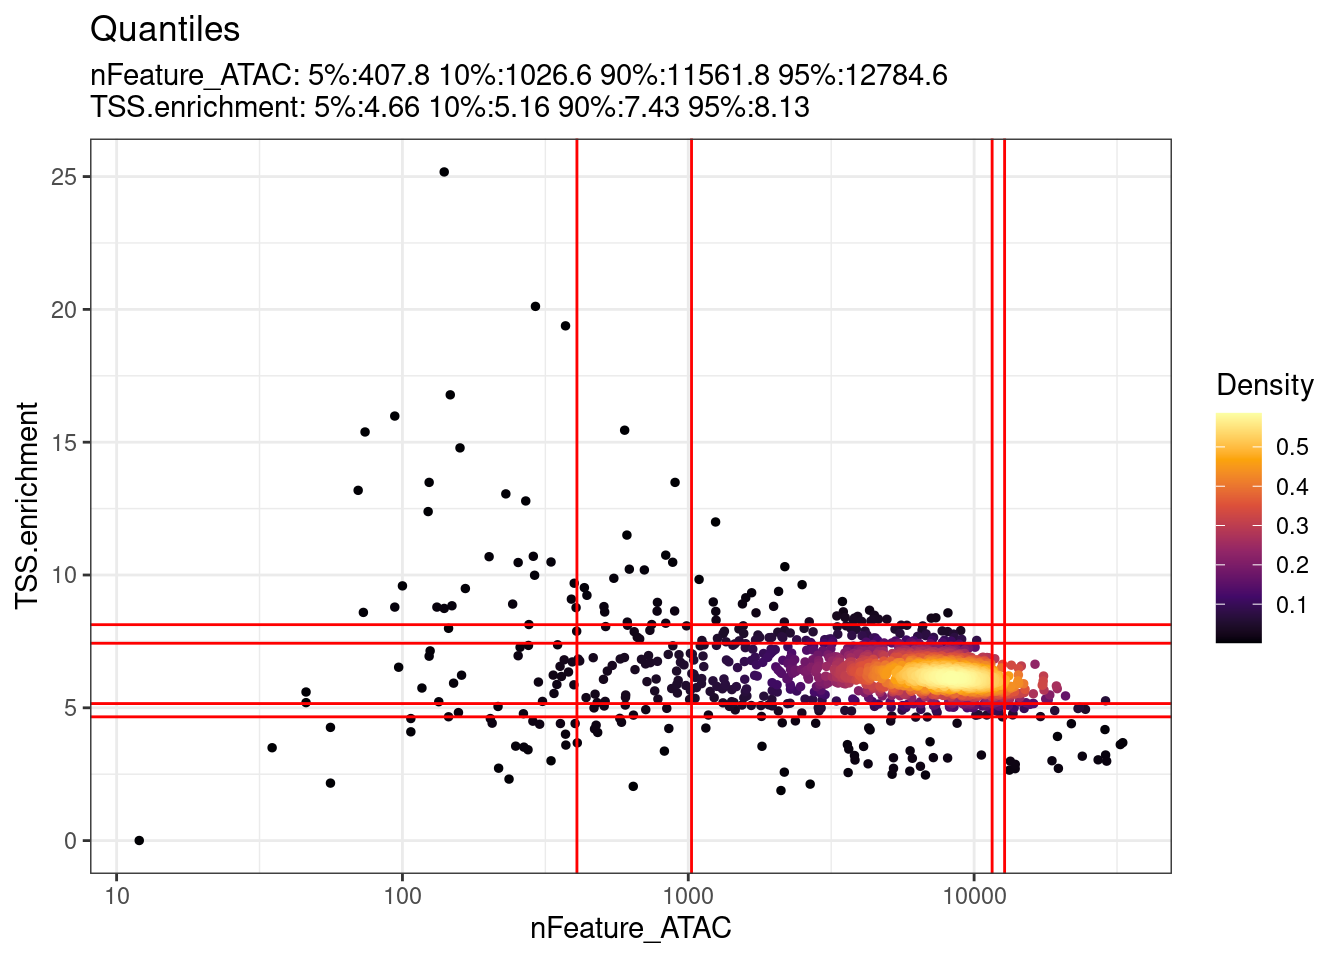
6.3.2 Sample C
DensityScatter(cntsC, x = 'nFeature_ATAC', y = 'TSS.enrichment',
               log_x = TRUE, quantiles = TRUE)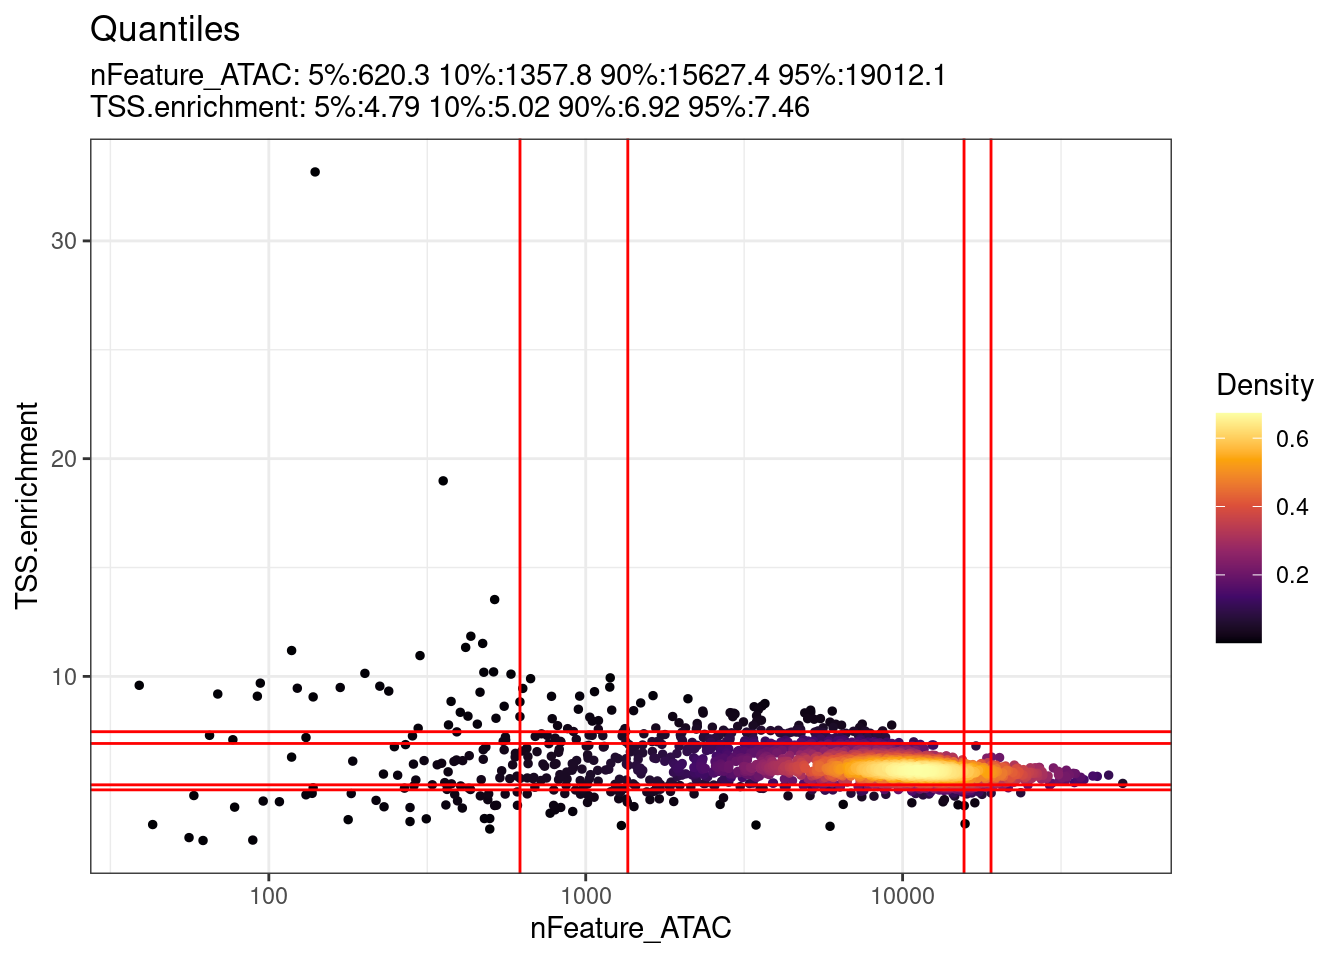
6.3.3 Sample D
DensityScatter(cntsD, x = 'nFeature_ATAC', y = 'TSS.enrichment',
               log_x = TRUE, quantiles = TRUE)