22 chromVAR TF Activity
While motif enrichment (previous chapter) tests whether a TF motif is over-represented among a cluster’s marker peaks, chromVAR estimates a per-cell TF activity score directly from motif accessibility, independent of any prior clustering or marker step. This gives a continuous, per-cell measure of TF activity that can be visualised on the WNN embedding and tested for differential activity between clusters, complementing the discrete per-cluster motif enrichment result.
22.1 Load motif-annotated object
library(Seurat)
library(Signac)
library(chromVAR)
library(TFBSTools)
library(JASPAR2020)
library(presto)
library(dplyr)
library(ggplot2)


mygenome <- BSgenome.Hsapiens.UCSC.hg38
genome(mygenome) <- NA

pfm <- getMatrixSet(
  x = JASPAR2020,
  opts = list(collection = "CORE", tax_group = "vertebrates", all_versions = FALSE)
)
df_pfm <- data.frame(t(sapply(pfm, function(x)
  c(id = x@ID, name = x@name, symbol = ifelse(!is.null(x@tags$symbol), x@tags$symbol, NA)))))
22.2 Run chromVAR
DefaultAssay(combined) <- "ATAC"
combined <- RunChromVAR(combined, genome = mygenome)
22.3 Differential TF activity per cluster
A Wilcoxon rank-sum test (presto::wilcoxauc) is run on the chromVAR
deviation scores per cluster (cell_labels, resolution 0.8) to identify TFs
with significantly elevated activity in each cluster. Enrichment is
restricted to motifs with padj < 0.01 and auc > 0.7, and further
restricted to motifs whose symbol matches a curated human TF list
(AnimalTFDB4) so that only bona fide TFs — not general accessibility-linked
motifs — are carried forward into the GRN chapter.
DefaultAssay(combined) <- "chromvar"

DA_motifs_ct <- wilcoxauc(combined, group_by = "cell_labels", seurat_assay = "chromvar") %>%
  mutate(symbol = setNames(ifelse(is.na(df_pfm$symbol), df_pfm$name, df_pfm$symbol),
                           df_pfm$id)[feature])

enriched_motifs_ct <- DA_motifs_ct %>%
   dplyr::filter(padj < 0.01 & auc > 0.7) %>%
  group_by(group)

top_motifs_ct <- top_n(enriched_motifs_ct, 3, wt = auc)
22.4 Visualise top motif activity per cluster
bluered_colscheme <- colorRampPalette(rev(c("#d73027", "#f46d43", "#fdae61", "#fee090",
                                            "#e0f3f8", "#abd9e9", "#74add1", "#4575b4")))

FeaturePlot(combined,
           features = top_motifs_ct$feature,
           cols = bluered_colscheme(30),
           reduction = "integration.wnn",
           ncol = 3) & NoAxes() & NoLegend()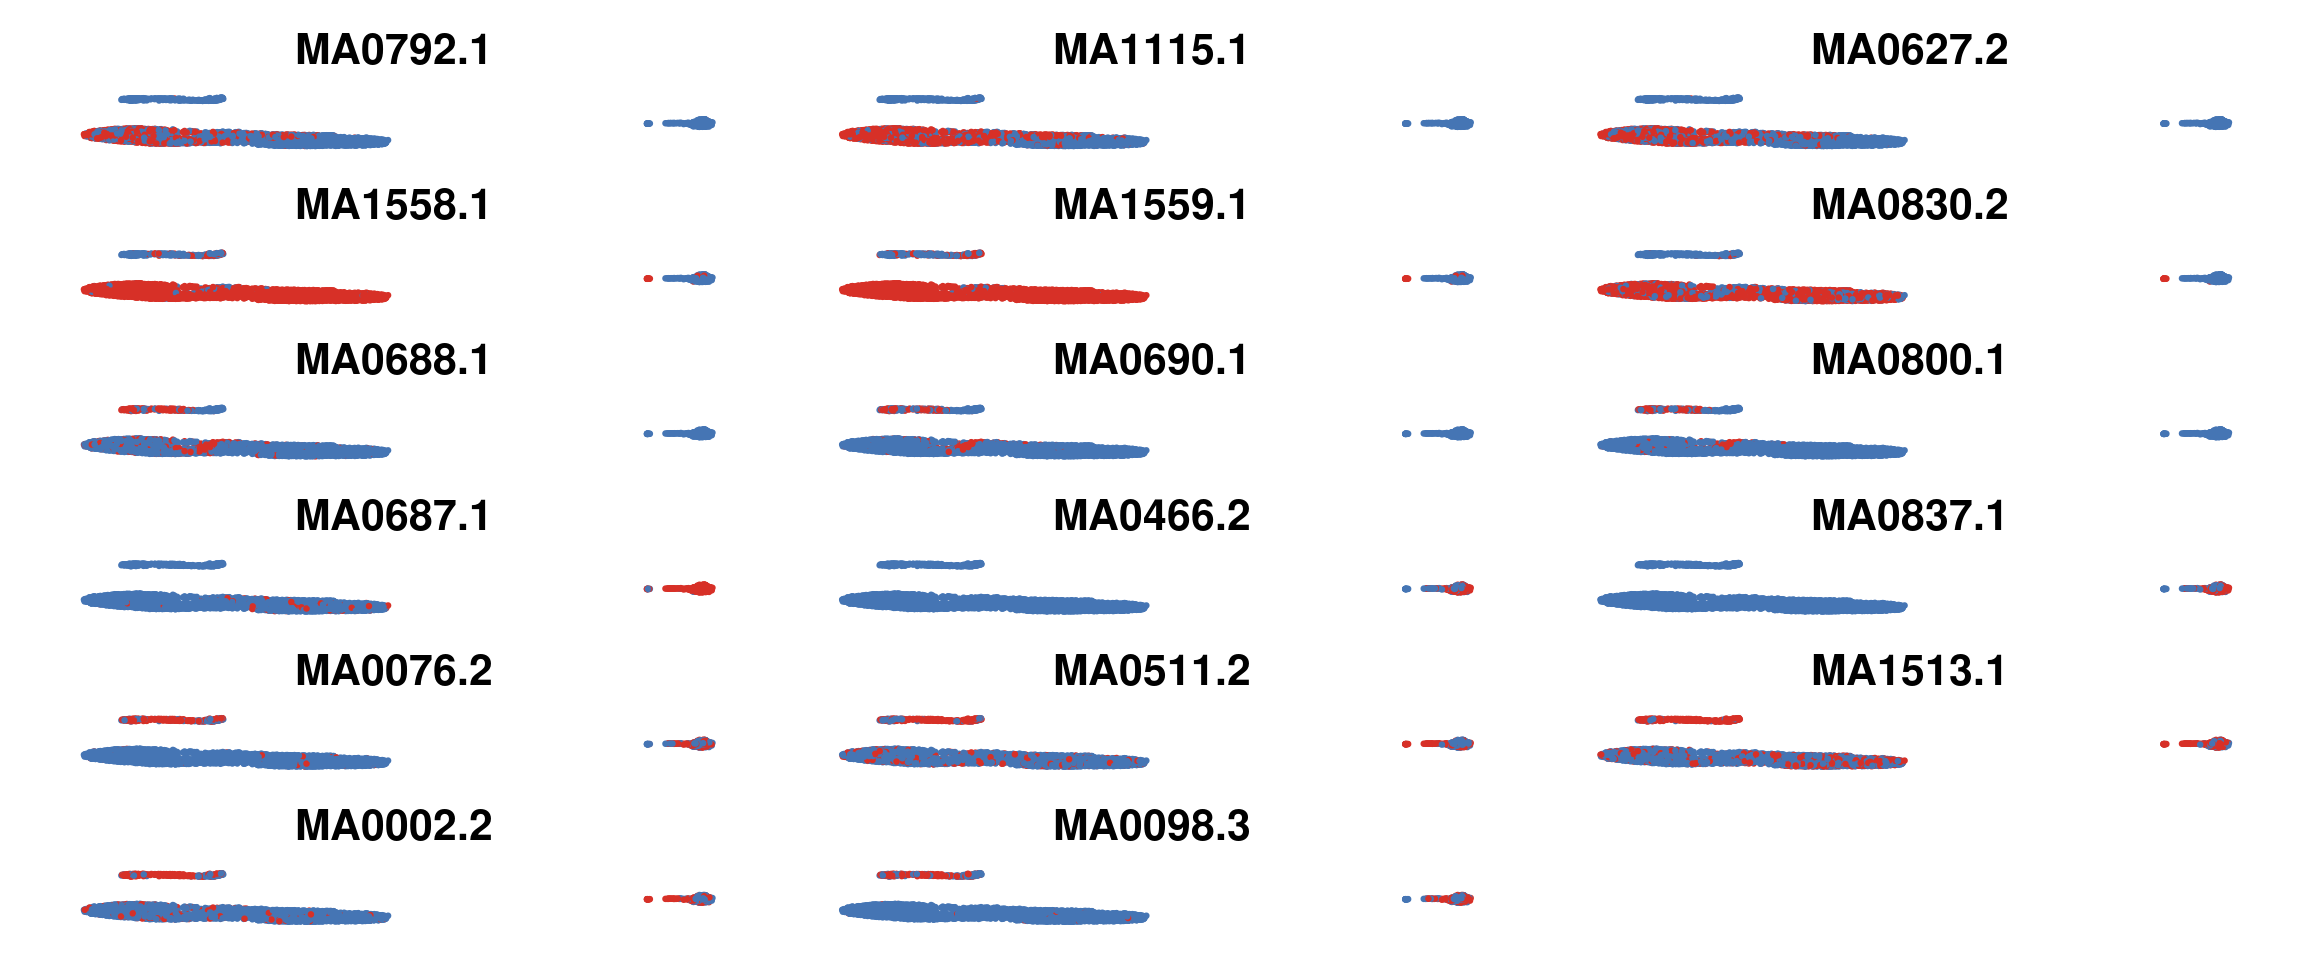
22.5 Restrict to known transcription factors
# Source: https://guolab.wchscu.cn/AnimalTFDB4_static/download/TF_list_final/Homo_sapiens_TF
# FIXED: original read.table() call used a relative path; assumed location below —
# confirm this matches where the TF list was actually downloaded.
tfs <- read.table("~/data/tasks/liam.kealy/processing/Homo_sapiens_TF", sep = "\t", header = TRUE)

tf_motifs_ct <- enriched_motifs_ct %>%
   dplyr::filter(symbol %in% tfs$Symbol)
22.6 Save results
SaveSeuratRds(combined, "data/seurat_object_cross_modal_integration_peakslinks_motifs_chromvar.rds")
saveRDS(tf_motifs_ct, "data/tf_motifs_ct.rds")