11 ATAC Processing
11.1 Dimensionality reduction
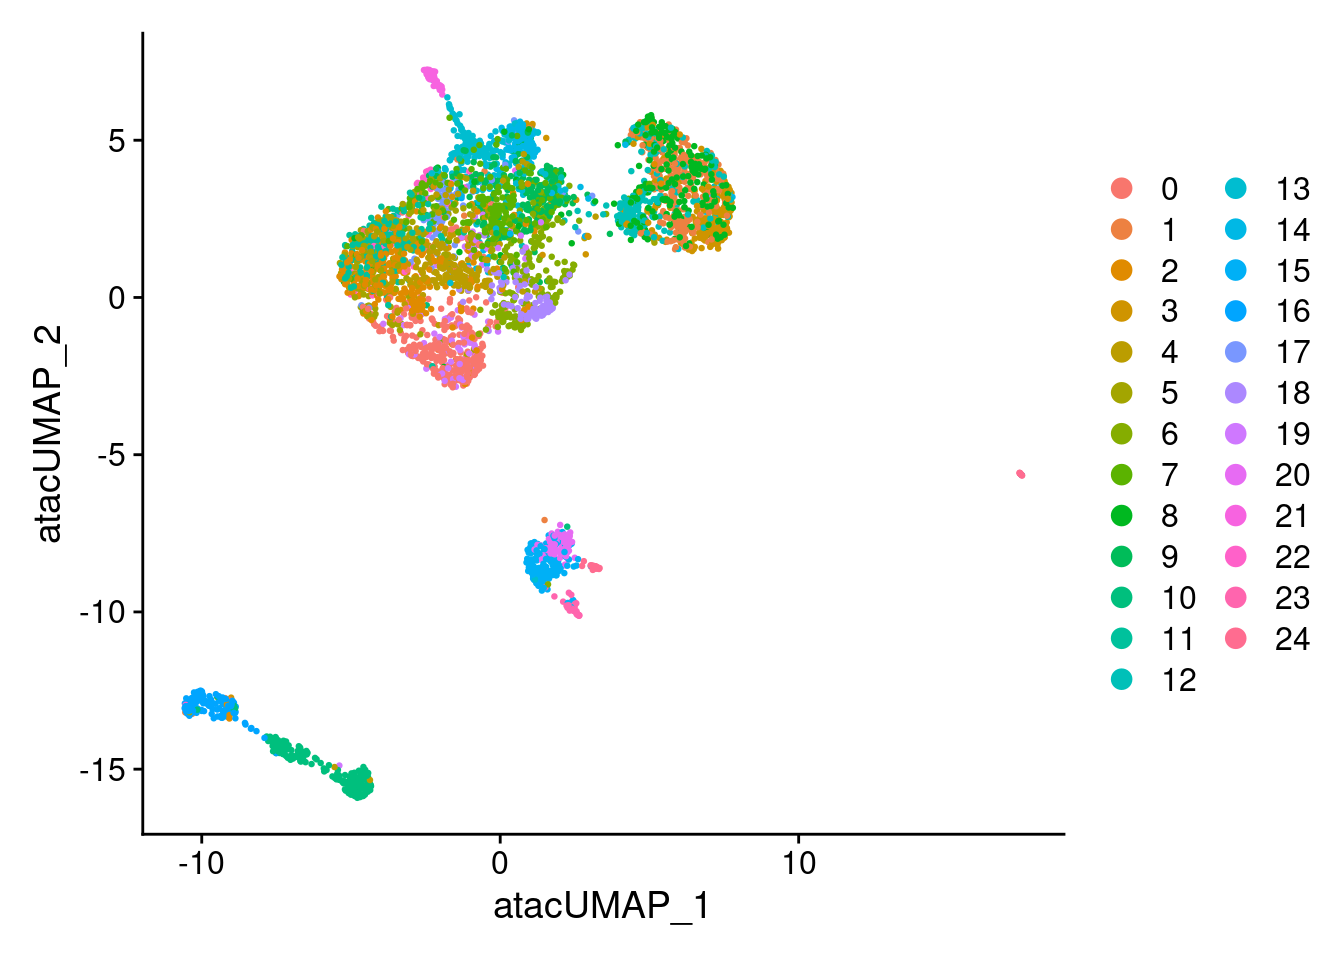
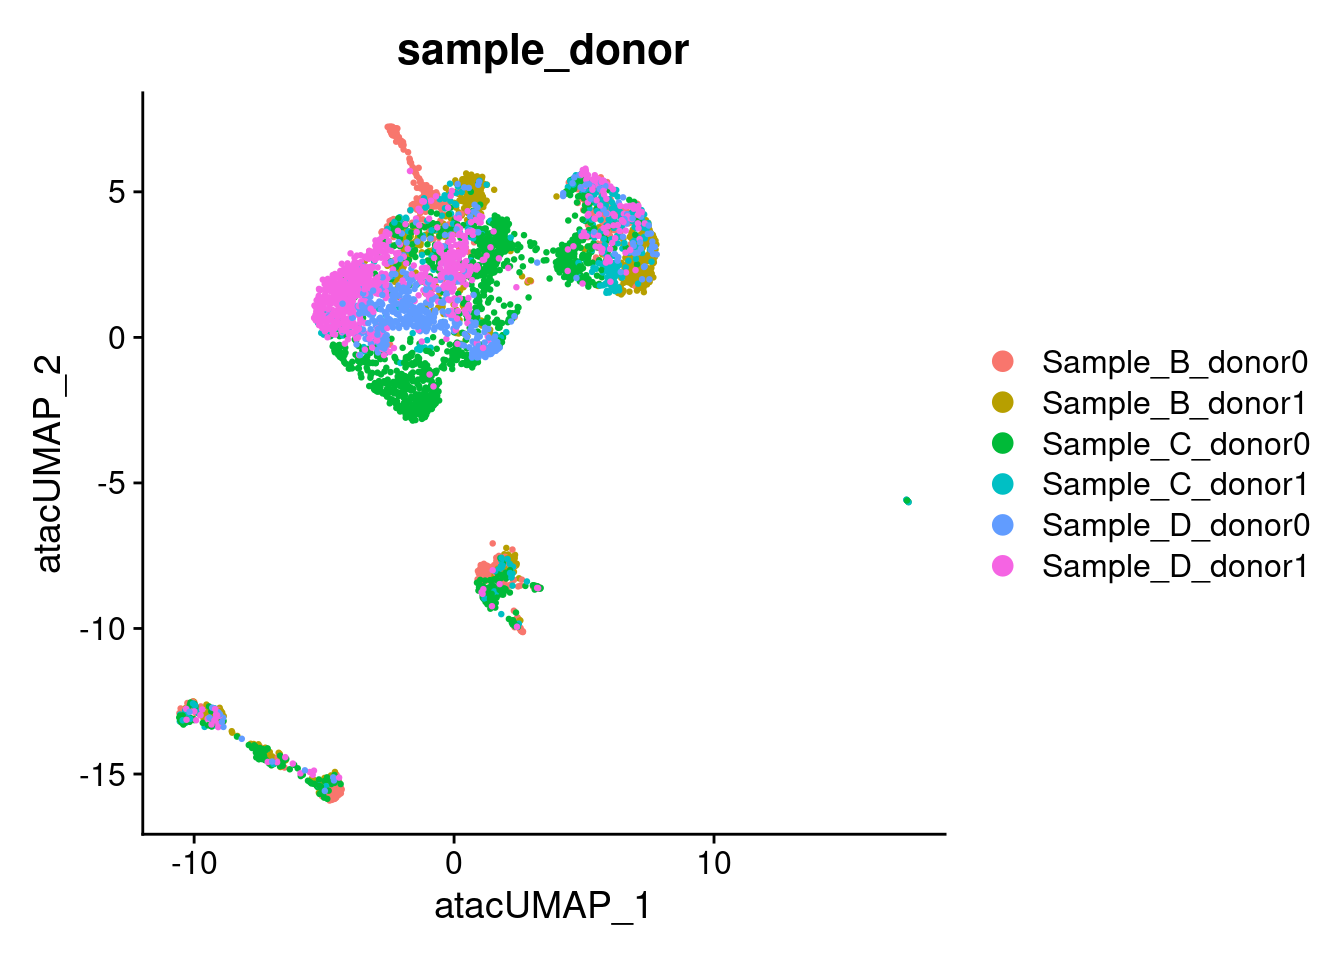
Process the ATAC assay using TF-IDF (term frequency–inverse document frequency) normalisation followed by singular value decomposition (SVD) to generate a latent semantic indexing (LSI) embedding. Unlike PCA, the first LSI component typically reflects sequencing depth rather than biological variation and is excluded from downstream analyses; dimensions 2–50 are used instead. A UMAP is computed from the LSI embedding for visualisation.
DefaultAssay(combined) <- "ATAC"

combined <- RunTFIDF(combined)
combined <- FindTopFeatures(combined, min.cutoff = 20)
combined <- RunSVD(combined)
combined <- RunUMAP(combined, dims = 2:50,
                   reduction      = 'lsi',
                   reduction.name = "umap.atac",
                   reduction.key  = "atacUMAP_")
11.2 LSI diagnostics
11.2.1 Elbow plot
The elbow plot shows the variance explained by each LSI component. Use this alongside the depth correlation plot to decide how many components are informative for downstream analysis.
ElbowPlot(combined, ndims = 30, reduction = "lsi")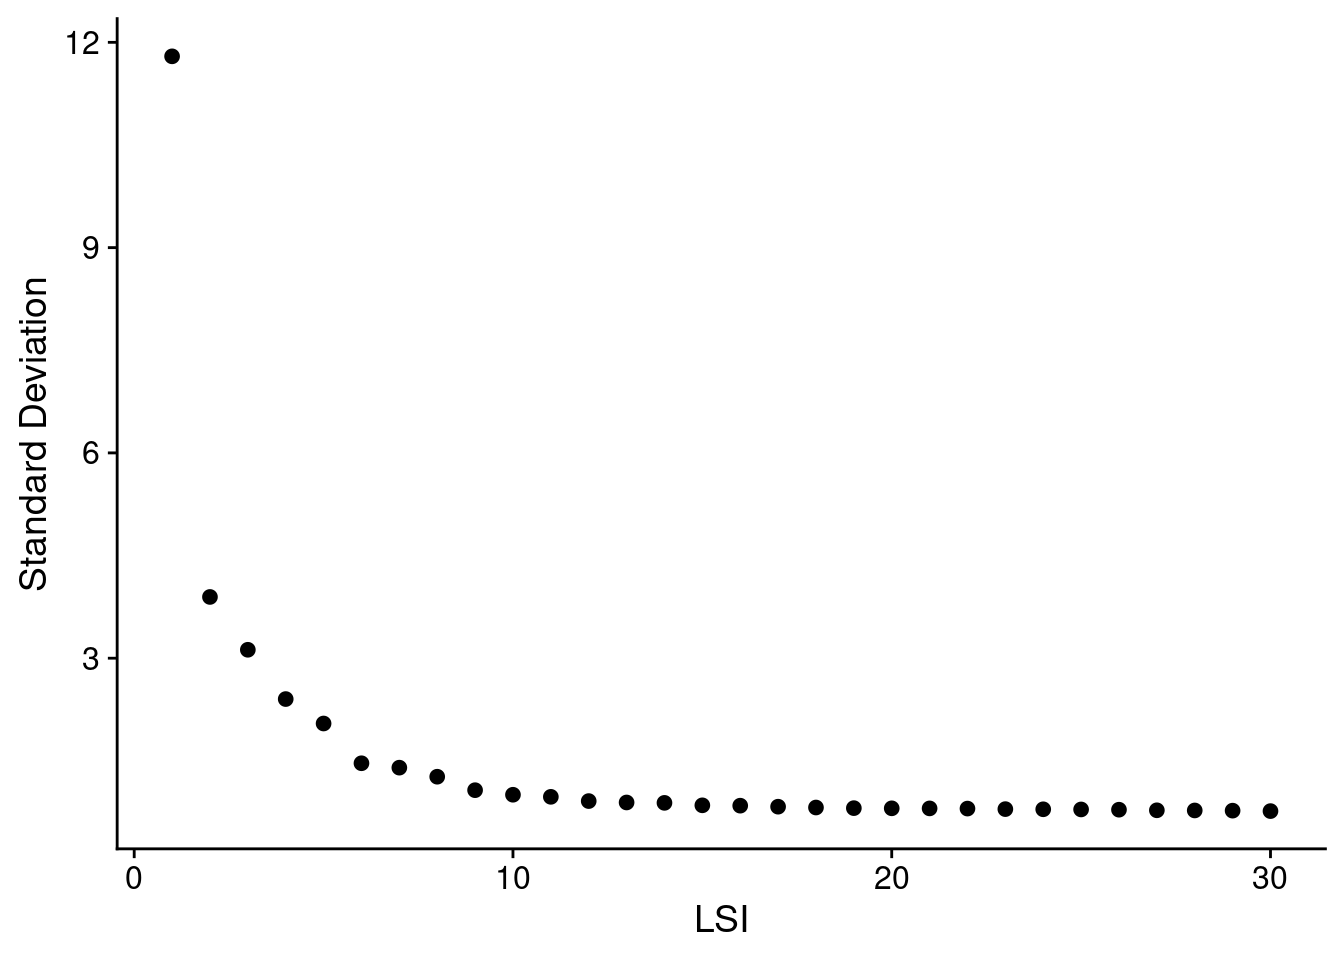
11.2.2 Depth correlation
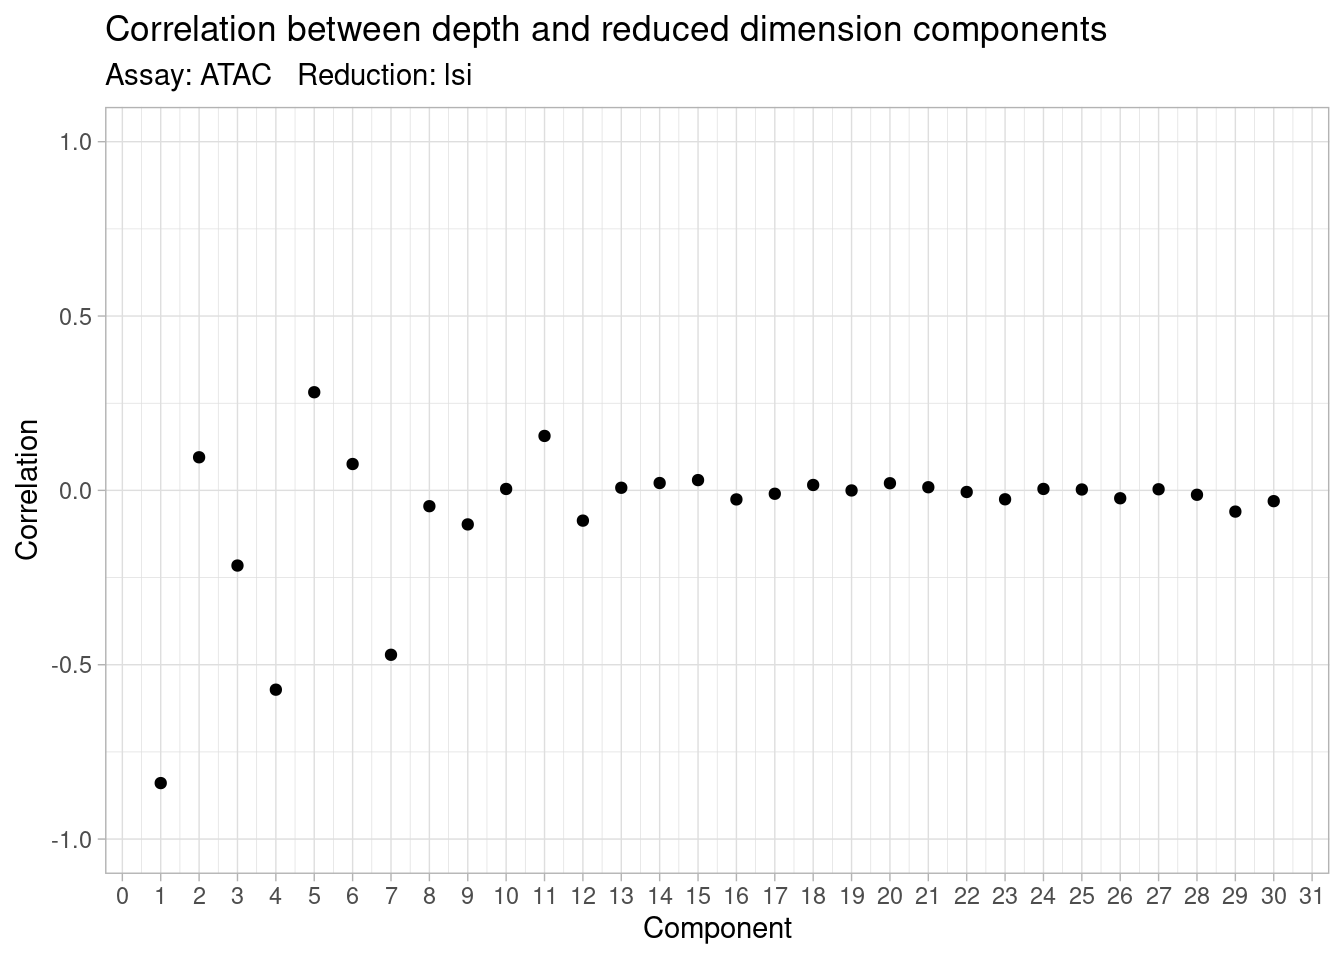
The depth correlation plot shows the correlation of each LSI component with total fragment count per cell. Component 1 typically shows a high correlation with sequencing depth; this confirms why it is excluded. Components with low depth correlation carry cell-type-specific biological signal.
DepthCor(combined, n = 30)