15 RNA Batch Correction
Batch effects in the RNA modality are corrected using Seurat v3 canonical
correlation analysis (CCA) integration. The strategy is to first process the
Healthy and PASC subsets independently on the RNA assay to identify
cell-type marker genes, then use those markers as anchor features to align
the two conditions into a shared integrated assay. Using cell-type-defining
marker genes rather than highly variable genes as anchors focuses the CCA on
biological variation rather than technical differences between conditions.
15.1 Select the RNA assay
DefaultAssay(combined) <- 'RNA'15.2 Per-condition processing
Each condition is processed independently to obtain per-condition clusters
and marker genes. The ribosomal module score (ribo_genes2) computed in the
confounding factors chapter is regressed out during scaling. Named reductions
are used throughout to avoid any ambiguity with reductions from other chapters.
15.2.1 Healthy
healthy <- subset(combined, subset = individual_condition == "Healthy")
healthy <- NormalizeData(healthy, verbose = FALSE)
healthy <- FindVariableFeatures(healthy, selection.method = 'vst', nfeatures = 1000)
healthy <- ScaleData(healthy, vars.to.regress = "ribo_genes2")
healthy <- RunPCA(healthy,
                  features       = Seurat::VariableFeatures(object = healthy),
                  reduction.name = "pca.healthy",
                  reduction.key  = "PChealthy_")
healthy <- RunUMAP(healthy, dims = 1:15,
                   reduction      = "pca.healthy",
                   reduction.name = "umap.rna.healthy",
                   reduction.key  = "UMAPRNA_healthy_")
healthy <- FindNeighbors(healthy, reduction = "pca.healthy", dims = 1:15)

resolution <- 2
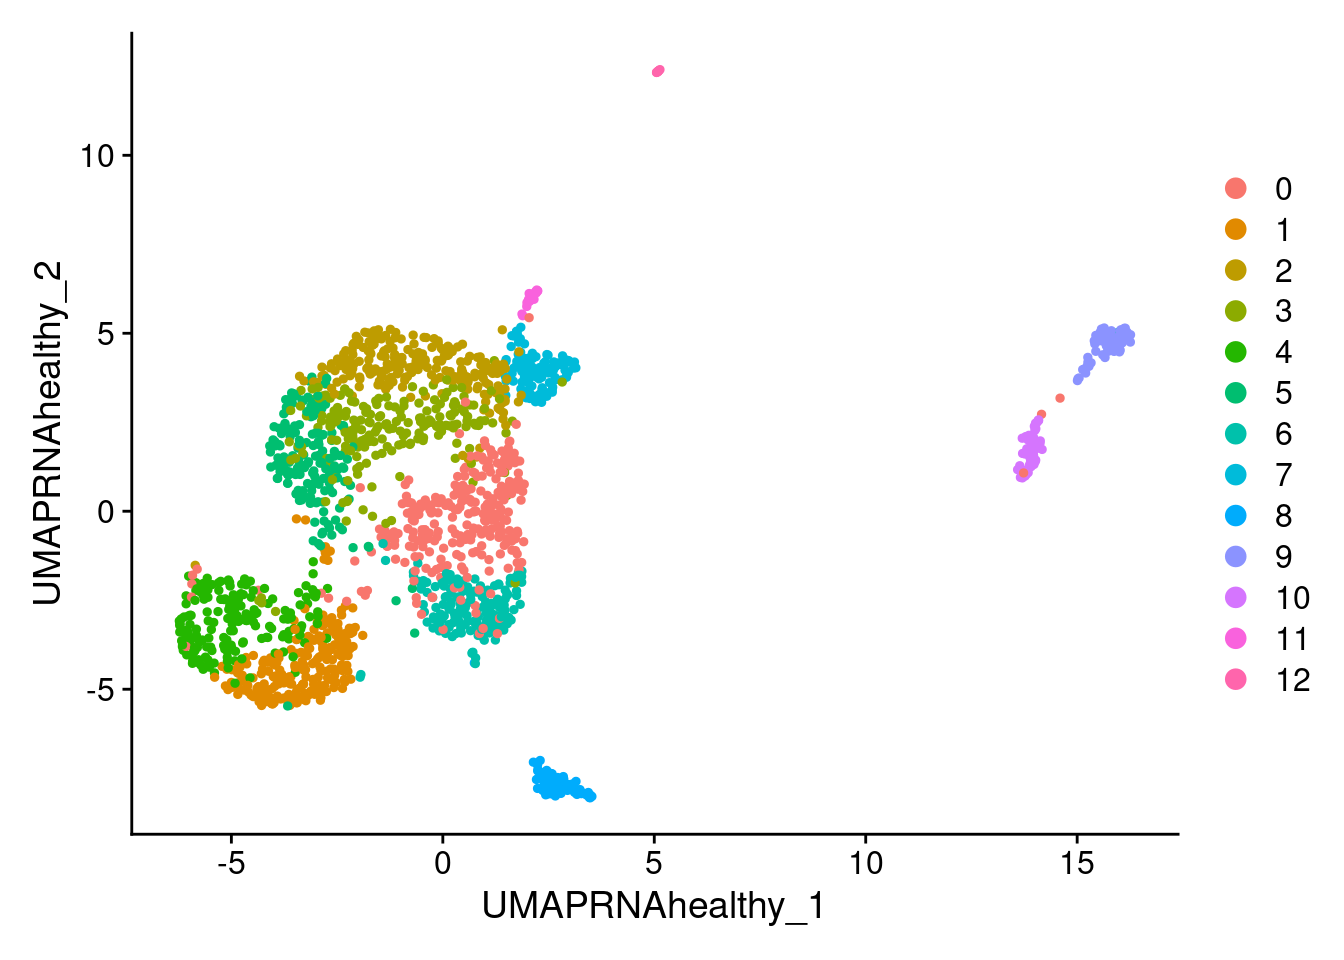
healthy <- FindClusters(healthy, resolution = seq(0.1, resolution, 0.1))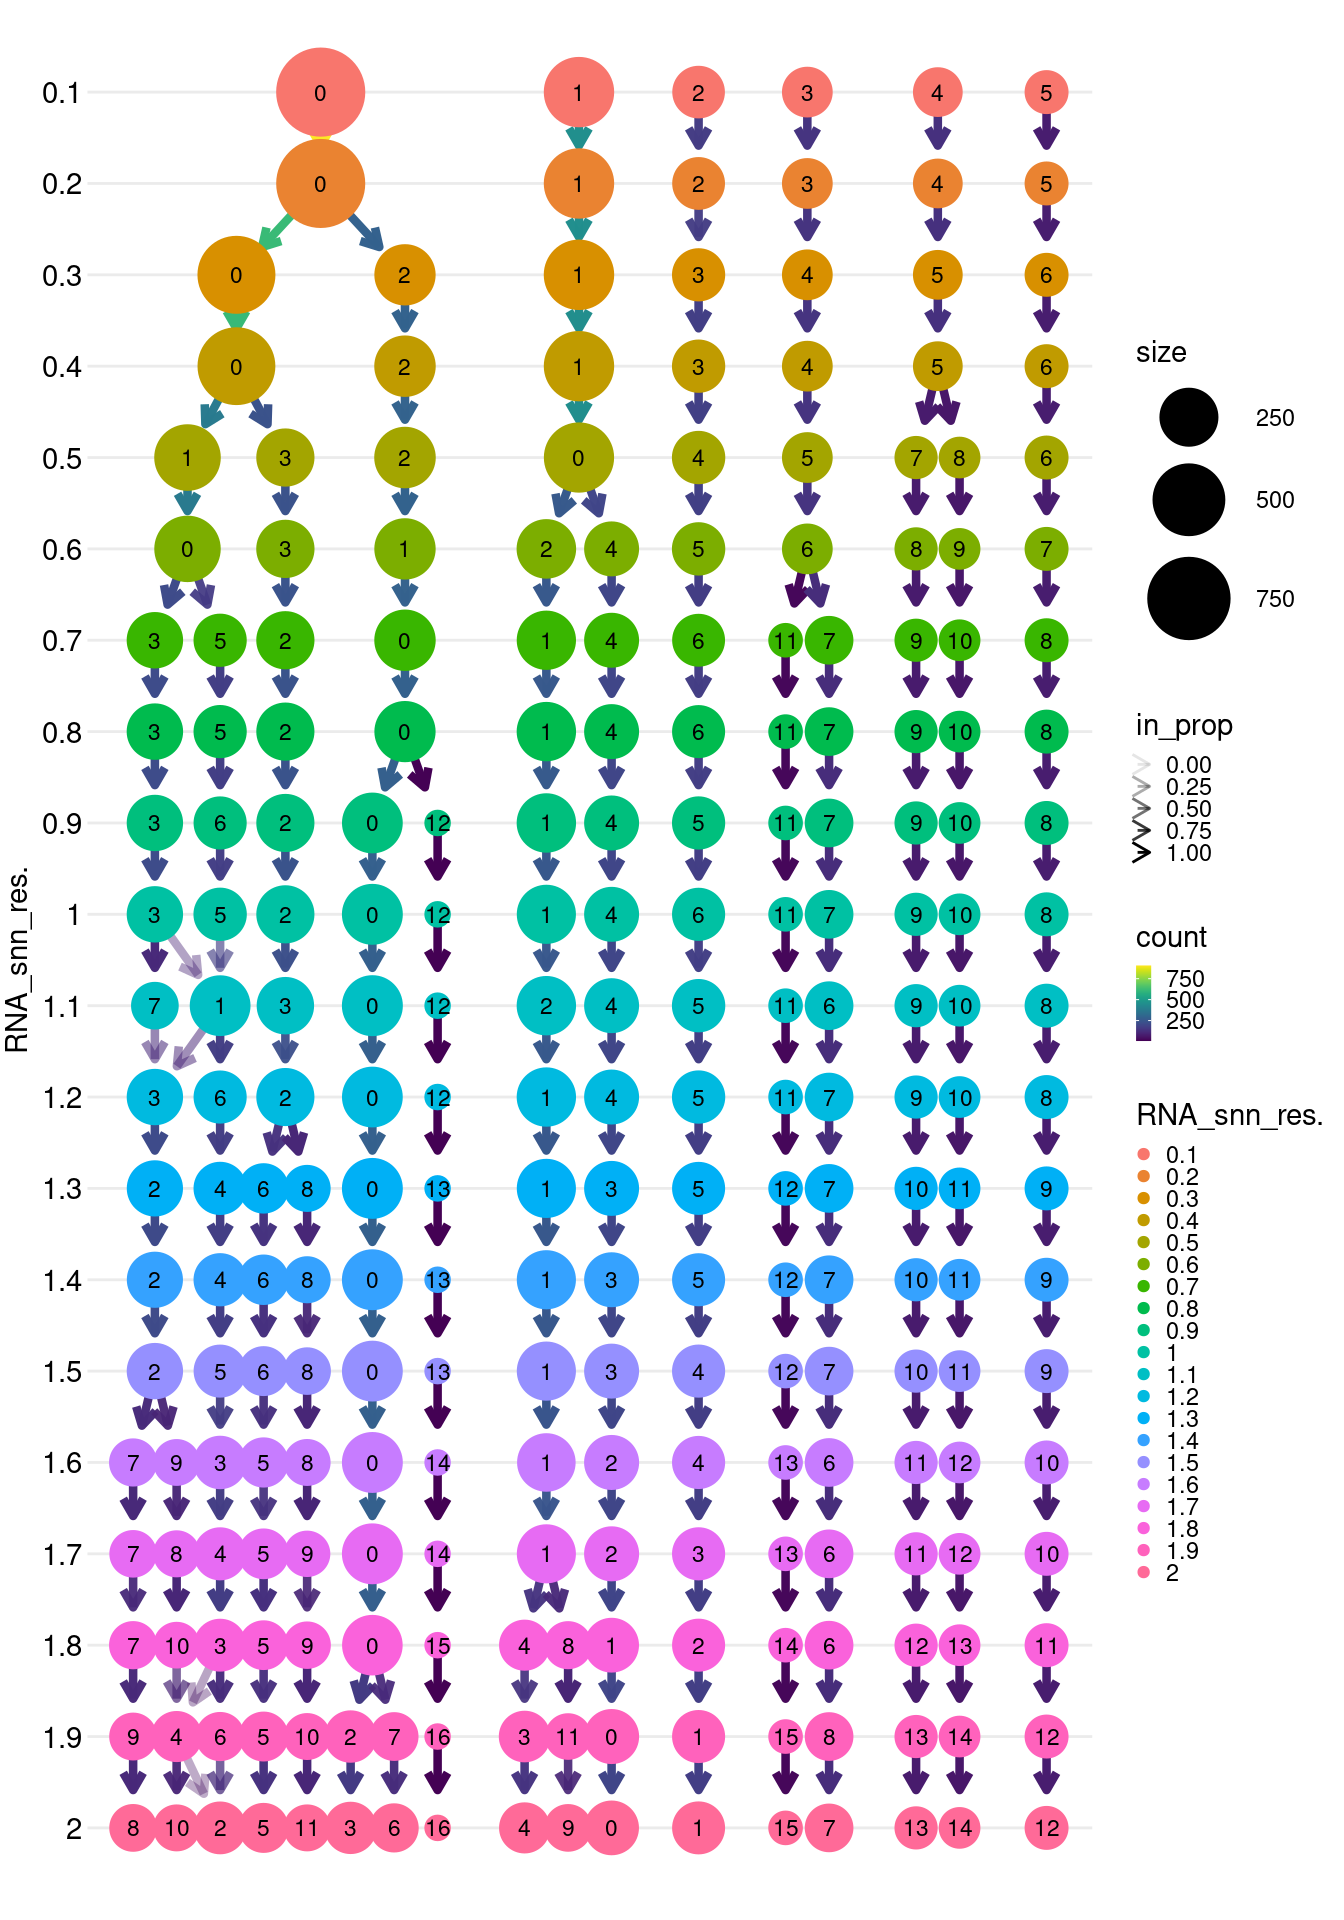
15.2.2 PASC
PASC <- subset(combined, subset = individual_condition == "PASC")
PASC <- NormalizeData(PASC, verbose = FALSE)
PASC <- FindVariableFeatures(PASC, selection.method = 'vst', nfeatures = 1000)
PASC <- ScaleData(PASC, vars.to.regress = "ribo_genes2")
PASC <- RunPCA(PASC,
               features       = Seurat::VariableFeatures(object = PASC),
               reduction.name = "pca.PASC",
               reduction.key  = "PCPASC_")
PASC <- RunUMAP(PASC, dims = 1:15,
                reduction      = "pca.PASC",
                reduction.name = "umap.rna.PASC",
                reduction.key  = "UMAPRNA_PASC_")
PASC <- FindNeighbors(PASC, reduction = "pca.PASC", dims = 1:15)

PASC <- FindClusters(PASC, resolution = seq(0.1, resolution, 0.1))
PASC$ident_originallabels <- Idents(PASC)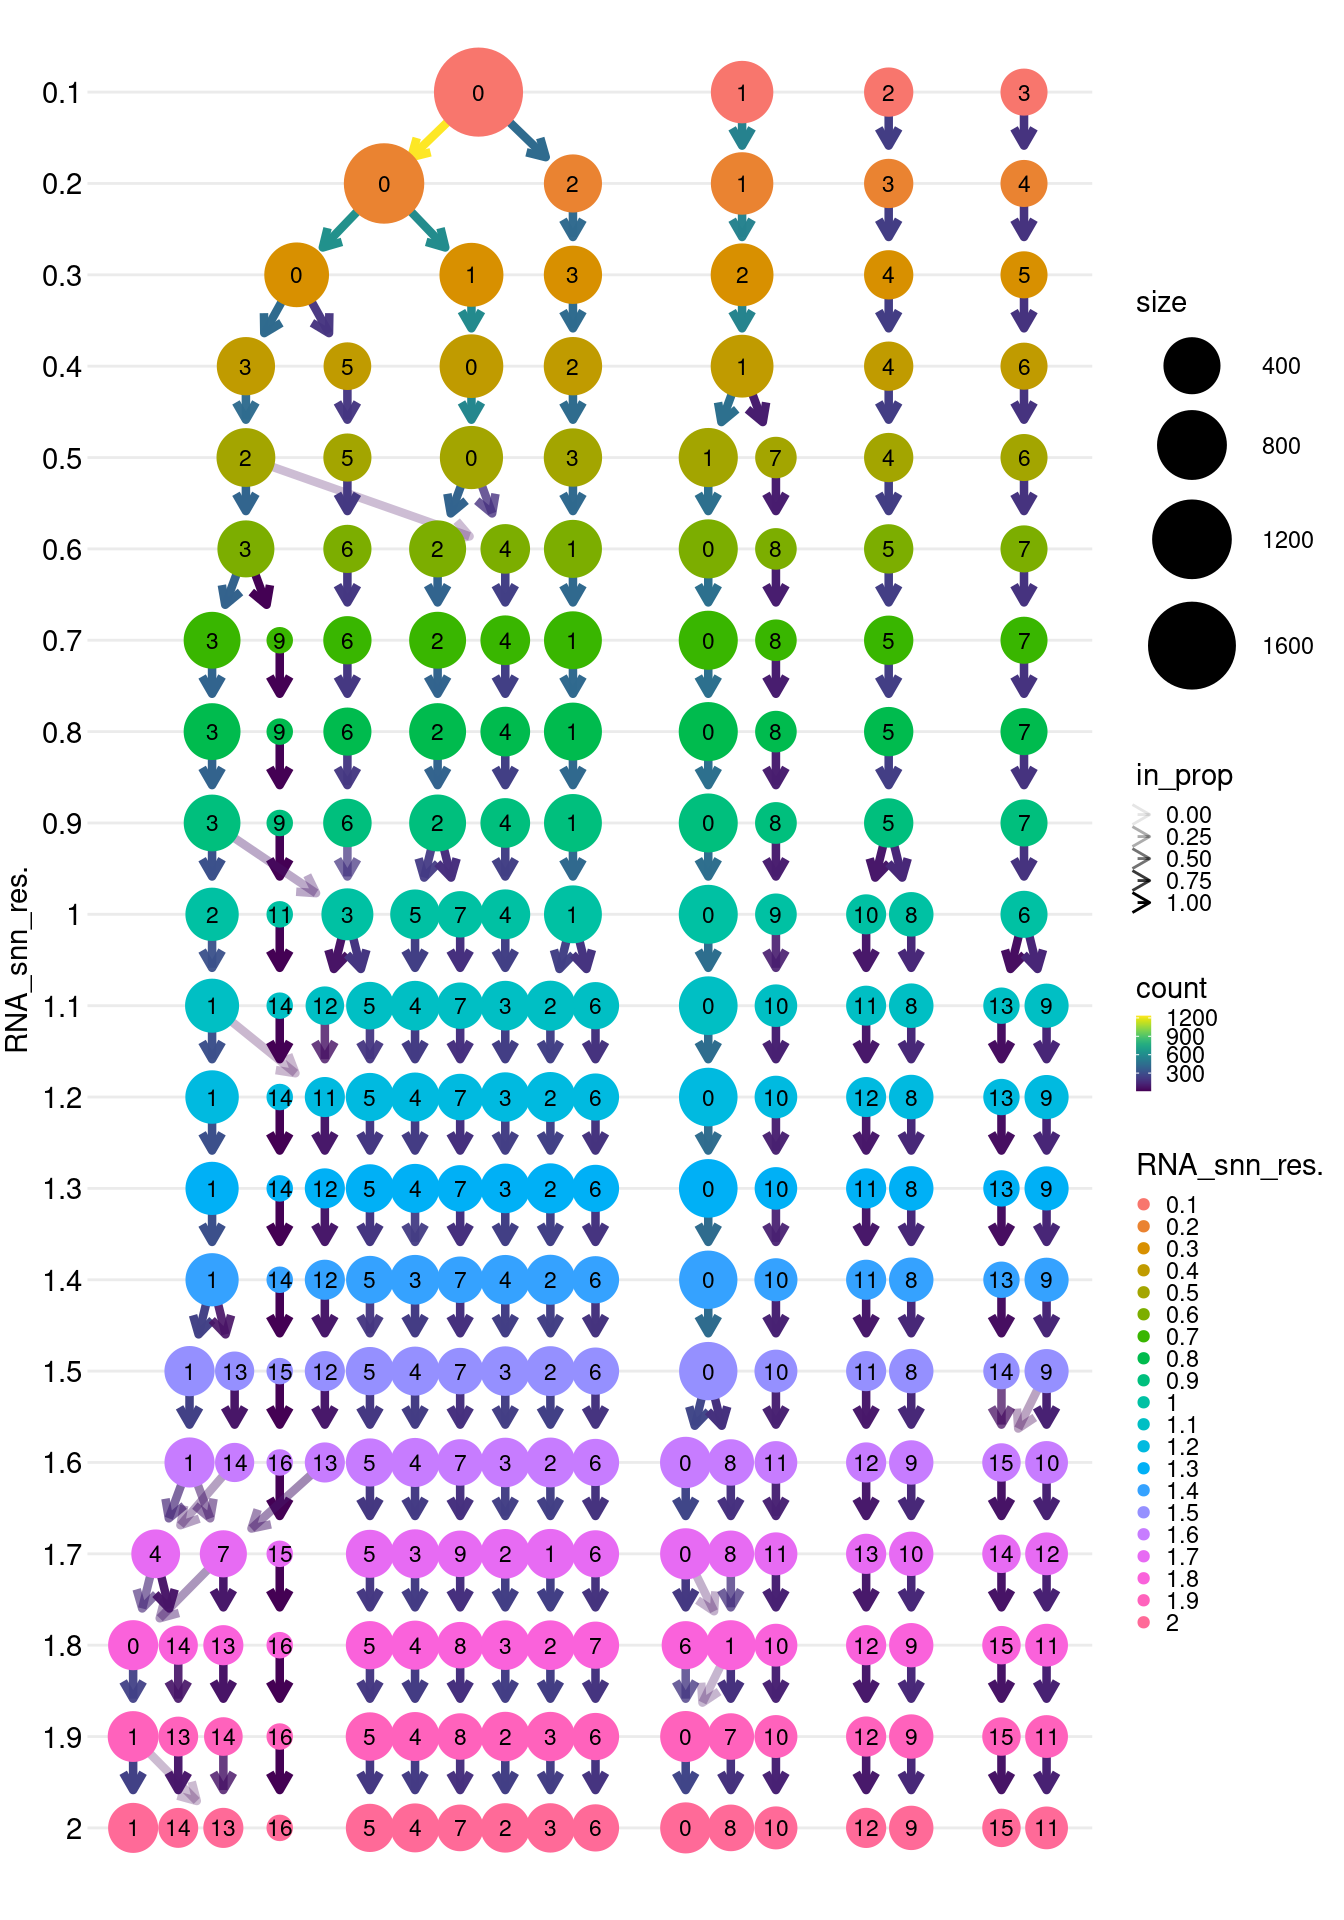
15.3 CCA Integration
15.3.1 Anchor feature selection
Marker genes are identified across the Healthy resolution sweep. The top 30 markers per cluster by average log2FC at resolution 1 are selected as anchor features. Duplicate genes are removed so each gene appears only once in the anchor feature list.
library(presto)

markers_list <- list()
for (res in seq(0.1, 1.9, 0.1)) {
  healthy     <- FindClusters(healthy, resolution = res, algorithm = 3)
  clustername <- paste0("RNA_snn_res.", res)
  Idents(healthy) <- healthy@meta.data[[clustername]]
  markers_list[[clustername]] <- wilcoxauc(healthy,
                                         group_by     = clustername,
                                         assay        = "data",
                                         seurat_assay = "RNA") %>%
  dplyr::filter(logFC > log(1.2) & padj < 0.01 & pct_in > 0.25)
}

healthy_markers_list <- markers_list[["RNA_snn_res.1"]]
found_markers <- healthy_markers_list
top30 <- found_markers %>%
  dplyr::group_by(group) %>%
  dplyr::top_n(n = 30, wt = logFC) %>%
  dplyr::select(feature)
top30    <- top30[!duplicated(top30$feature), ]
features <- top30$feature

ifnb.list <- list(healthy, PASC)
anchors   <- FindIntegrationAnchors(object.list = ifnb.list, anchor.features = features)
rna_integration  <- IntegrateData(anchorset = anchors)
15.3.2 Integrated PCA and UMAP
Scale the integrated assay and run PCA, storing the result under the named
reduction pca_integration. The UMAP (rna.integration) is computed from
pca_integration for visualisation only — the PCA is what feeds into the
cross-modal WNN graph in the next chapter.
DefaultAssay(rna_integration) <- "integrated"

rna_integration <- ScaleData(rna_integration, verbose = FALSE)
rna_integration <- RunPCA(rna_integration, npcs = 30, verbose = FALSE,
                   reduction.name = "pca_integration",
                   reduction.key  = "PCintegration_")

rna_integration <- RunUMAP(rna_integration, dims = 1:15,
                    reduction      = "pca_integration",
                    reduction.name = "rna.integration",
                    reduction.key  = "UMAPintegration_")

rna_integration <- FindNeighbors(rna_integration, reduction = "pca_integration", dims = 1:15,
                          graph.name = c("rna.integration_nn", "rna.integration_snn"))
rna_integration <- FindClusters(rna_integration, graph.name = "rna.integration_snn",
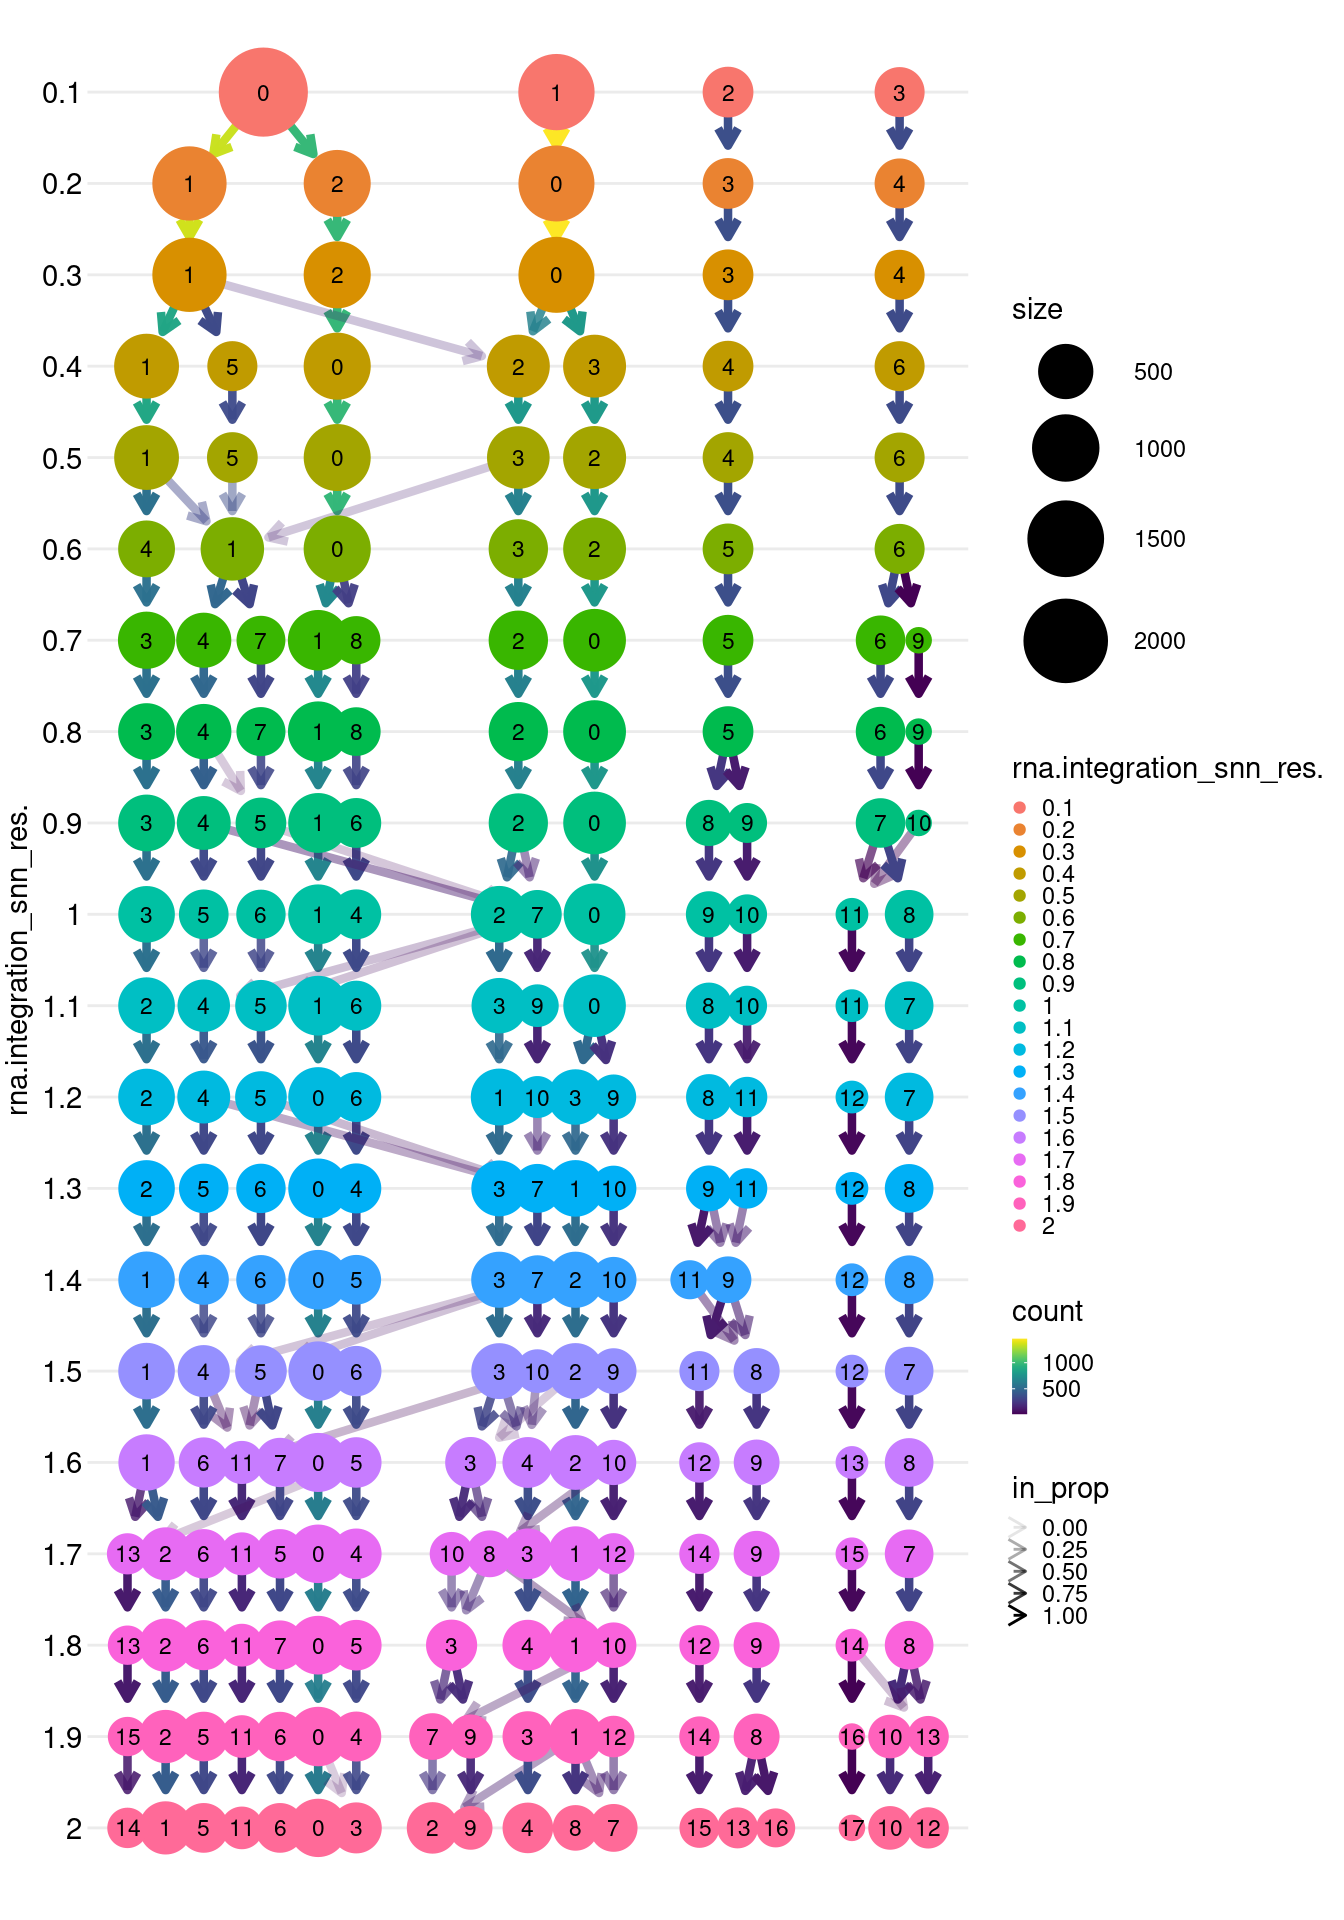
                         resolution = seq(0.1, resolution, 0.1))
15.3.3 Integration UMAP
Colour the integrated UMAP by sample, donor, and condition to confirm that the integration has removed condition-driven separation while preserving cell-type structure.
DimPlot(rna_integration, reduction = "rna.integration", group.by = "sample")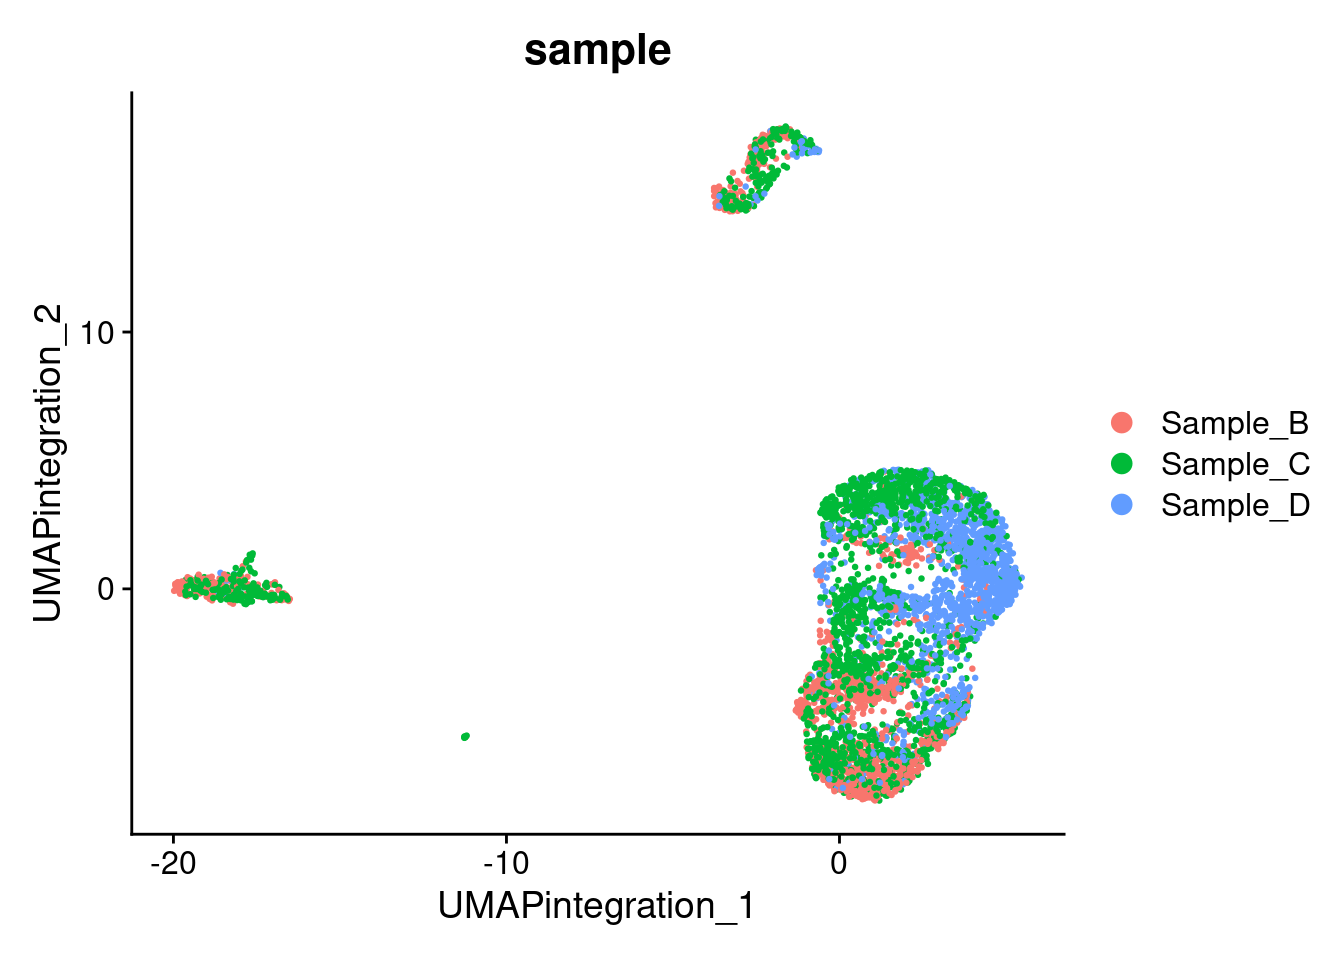
DimPlot(rna_integration, reduction = "rna.integration", group.by = "sample_donor")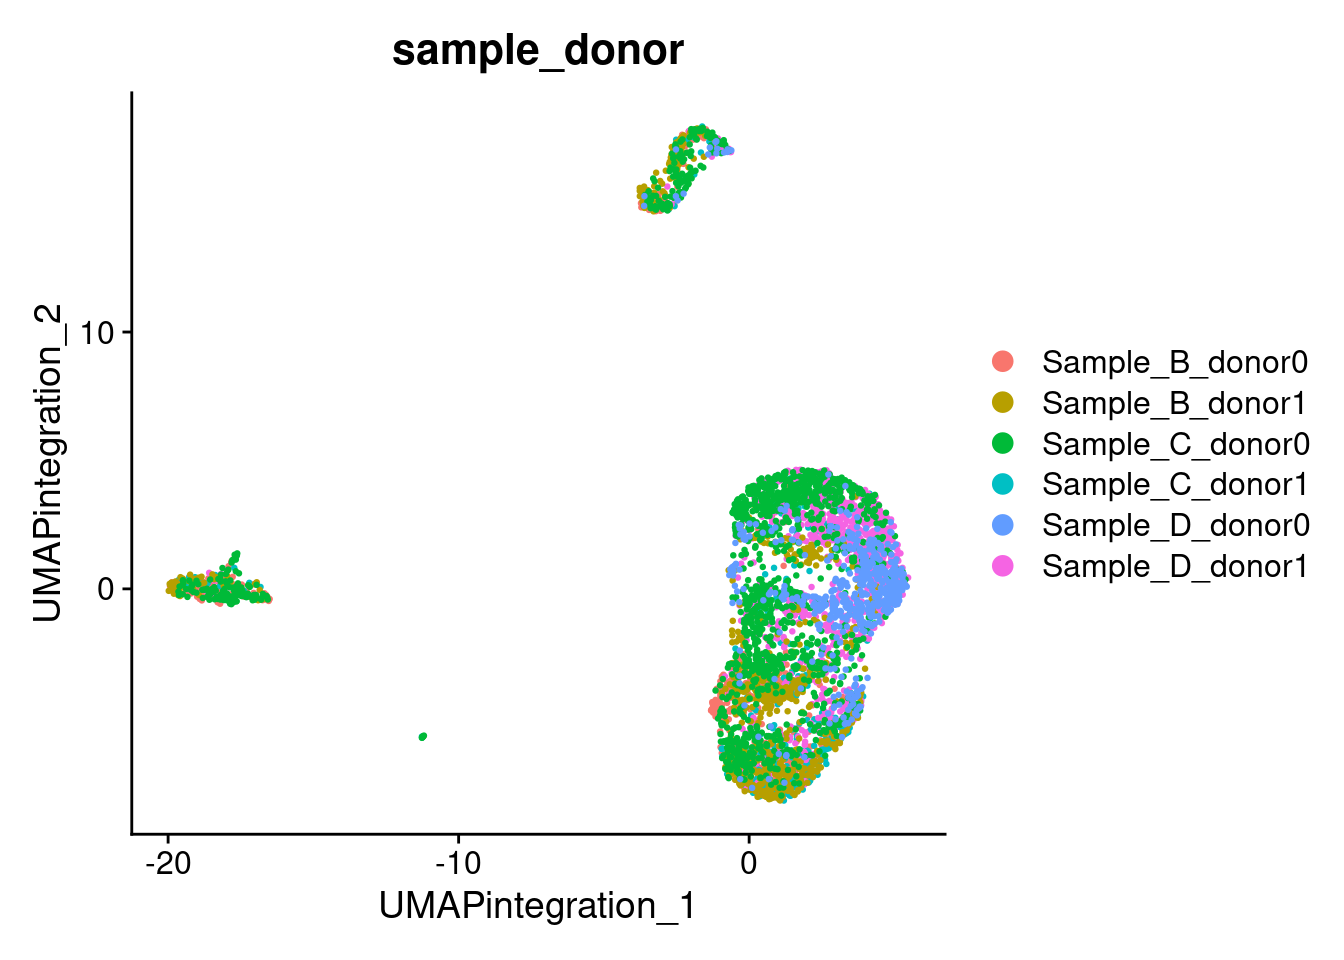
DimPlot(rna_integration, reduction = "rna.integration", group.by = "individual_condition")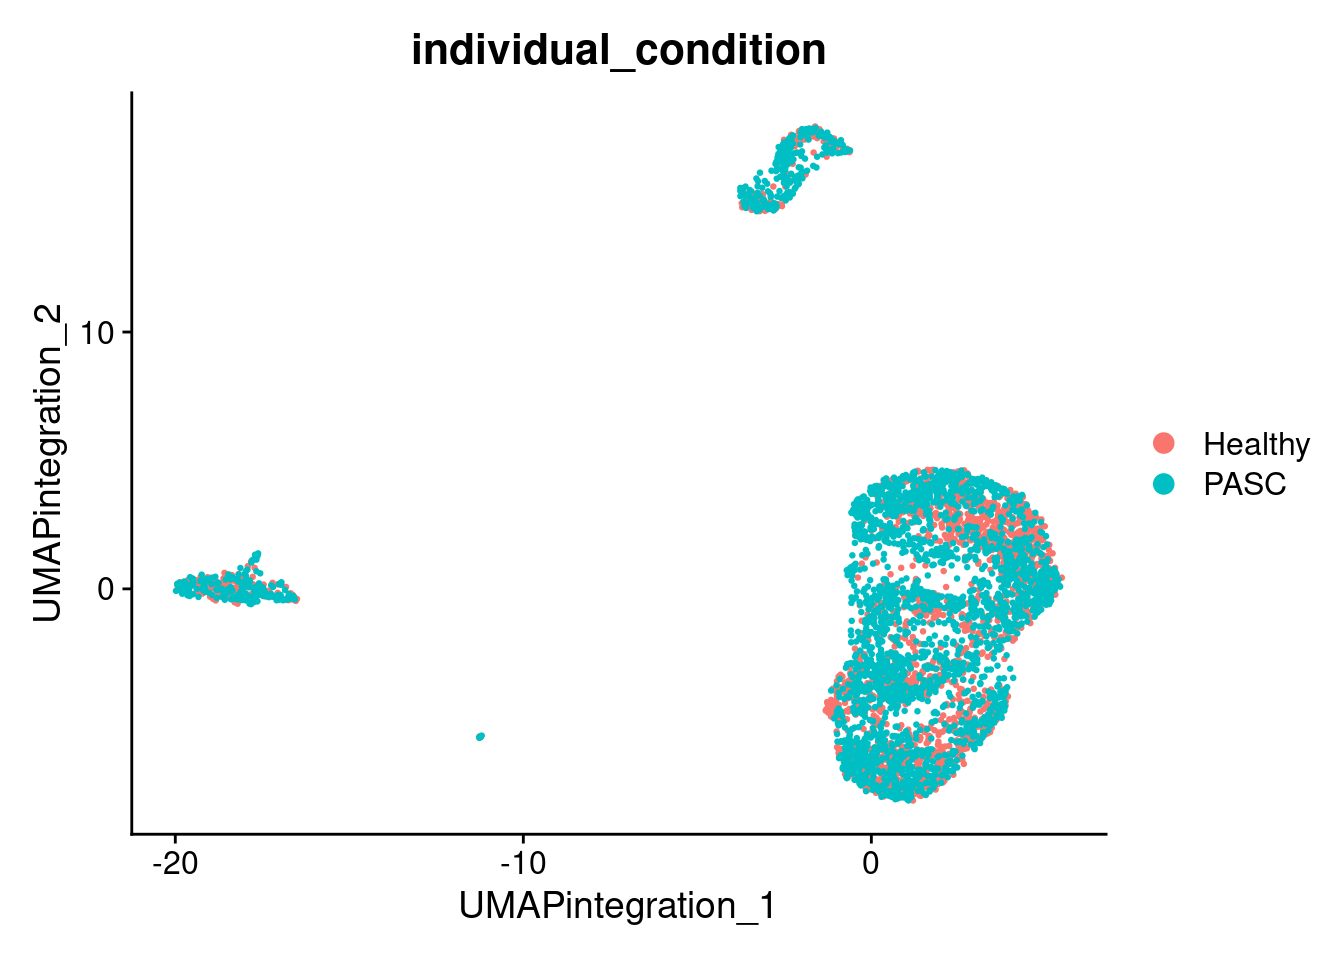
15.4 save the batch corrected assay
DefaultAssay(rna_integration)<-"RNA"
SaveSeuratRds(rna_integration, "data/rna_batch_corrected.rds")
15.5 Conclusion
RNA expression in this dataset is jointly driven by cell type and disease status (PASC vs Healthy), and these two axes are not separable in an uncorrected embedding — cluster boundaries would reflect both cell identity and disease state at once, confounding any later disease comparison.
To resolve this, integration anchors were derived from marker genes identified in the Healthy subset only (healthy_markers_list), then used with FindIntegrationAnchors/IntegrateData (CCA) to integrate Healthy and PASC cells into a shared space. Because these anchor genes capture cell-type-defining programs under normal physiology, using them for integration corrects for disease as a confounding factor, analogous to a batch effect, while preserving cell-type identity as the organizing signal.
As a result, clusters in the integrated (integration.rna/integration.wnn) space are driven by cell-type transcriptomic profile rather than disease-associated expression shifts. This is essential for the intended downstream analysis: within each cell type, PASC and Healthy cells now fall into shared clusters, allowing valid, cell-type-matched comparisons of disease vs healthy expression and chromatin accessibility.